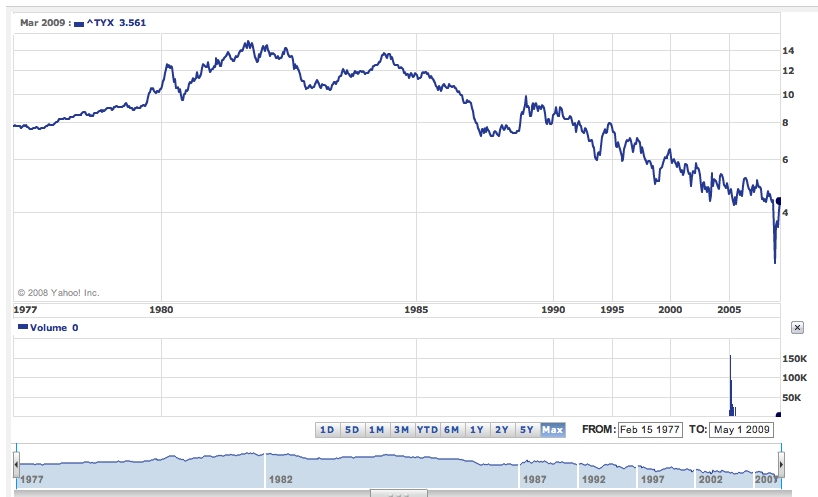
Nice thirty year chart showing the net change in interest rates, via the 30-year treasury bond.
Given the high (inverse) correlation between interest rates and stock prices, the 1982 to 2000 bull market is much less about productivity, ideology, or deficit reduction — it was about falling interest rates, plain & simple.
>
30 Year Treasury Bond, 1979 – 2009

via Yahoo! Finance
>
Hat tip Paul


What's been said:
Discussions found on the web: