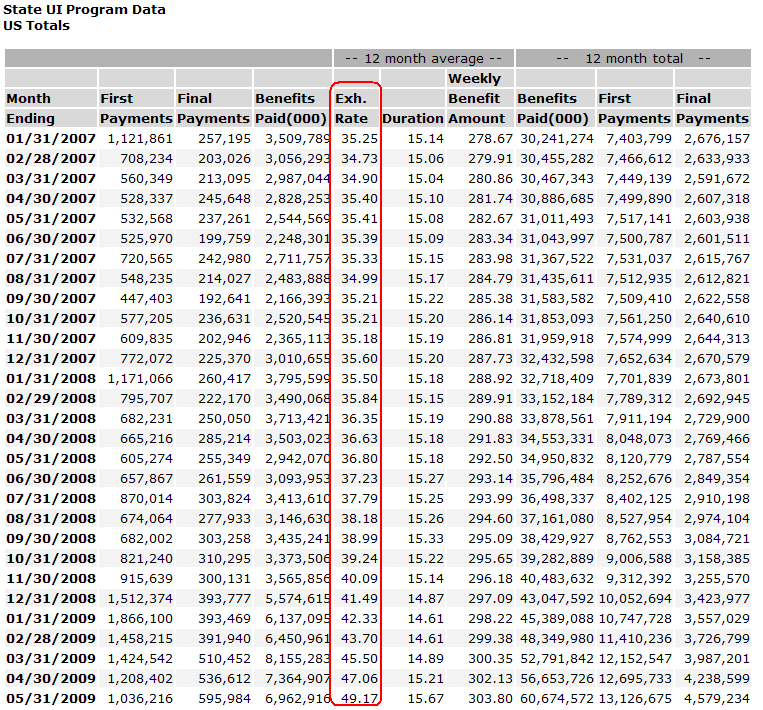
Our earlier post on Exhausted Unemployment claims has provoked an interesting (if wonky) discussion on Claims Exhaustion.
Yes, it is a moving average, but that rise starting in December 2007 — when the recession began — which spiked vertically is unmistakable.
Here is the Labor Department data source, and their description of the data series:
“The monthly summary report is intended to provide the user with a quick overview of the status of the UI system at the national and state levels. This summary report contains monthly information on claims activities and on the number and amount of payments under State unemployment insurance laws. This data is used in budgetary and administrative planning, program evaluation, and reports to Congress and the public.”
The data goes back to 1972.
I looked at a simple 24 month series:
>
As was noted by Transor Z earlier:
Since Exhaustion Rate was first reported for the 6/72 data set, the average value has been 34% and the median value has been 33%.
In 37 years there have been 44 monthly values of 40% or higher. Only 7 of these were NOT in the period 2002-2009 and the highest of these was the 8/31/83 set with 40.83.
38.3 was the peak for the 1970s — 11/30/76.
40.83 was the high for the 1980s — 8/31/83.
40.11 was the high for the 1990s — 11/30/92Until 3/31/09, the previous all-time high was set in 7/31/03 with 43.9. The March, April, and May figures have set successive all-time highs. You have to go back to 1/31/91 (29.87) to find a rate under 30%.
When you plot 12-month average benefits duration on the same graph, you see a clear correlation between the two. One question the data raise is that, during the early 80s recession, the average went over 17 weeks from 5/31/82 to 3/31/83. The 27 year average is 14.76 weeks. The latest figures put us only at 15.67 weeks. Given that even the “green shoots” crowd is predicting a jobless recovery at least in the short term, a 17+ week average would seem likely to follow, sending the exhaustion rate to further 27-year highs.
>
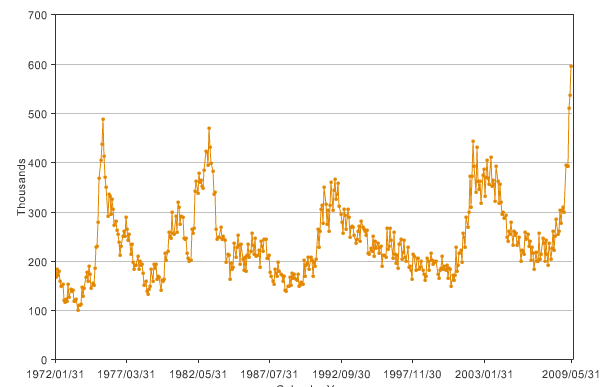
Here is another good chart showing the 2009 highs significantly above prior peaks:
>
Unemployment Benefit Exhaustions
Regular State UI Final Payments, Data from 1972 to 2009
Chart via BLS)
Exhaustions are the number of claimants who collect their full entitlement of unemployment insurance benefits. The data shown in the chart are for the regular state program.
(Hat tip, Kid Dynamite)


What's been said:
Discussions found on the web: