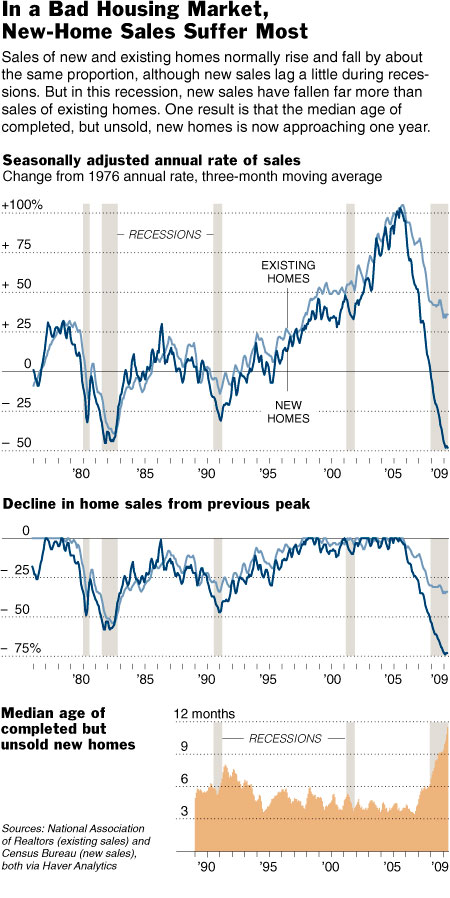
Floyd Norris cuts thru the bull to take a closer look at massively overbuilt New Home market:
“For more than three decades, the sales volume of existing single-family homes and newly built houses tended to rise and fall by about the same percentage, as can be seen in the accompanying charts. To be sure, sales of new homes did tend to do a little worse during recessions, but the difference was small and short-lived.”
See the two charts below — the first one shows sales volumes (all homes) from 1975 – 2009 (three-month moving averages)
Below that is the chart of showing how far sales fell from peak levels during each downturn. As Norris notes, “the plunge in sales of existing homes is severe but not unprecedented. But new-home sales are now running at only about a quarter of peak levels, a fall far deeper than anything seen since the statistics began being collected in the 1960s..”
Here are the charts in question:
>
Norris continues:
“At the peak of the housing boom in 2005, sales of both existing and new homes were running at twice the 1976 rate. This year, the sales rate for existing homes seems to have stabilized at about one-third higher than the 1976 rate. New-home sales also seem to have stabilized, but at about half the 1976 rate. . .
New-home prices, while they have fallen sharply, do not appear to have declined as far as prices of existing homes. At the worst point this year, the median price of existing homes was off 29 percent from the peak, while the largest drop for new-home prices was 23 percent.
Median home price figures need to be used with caution, since there is no way to know how the median home sold in one month compares, in terms of size and location, to the median home sold in a different month. But in past recessions, new-home prices have tended to be weaker than existing-home prices, the opposite of what has happened in this cycle.”
Its intriguing — but not surprising — that new Homes are faring worse than existing homes . . ..
>
Source:
A Recession Measured by New-Home Sales
FLOYD NORRIS
NYT, June 26, 2009
http://www.nytimes.com/2009/06/27/business/economy/27charts.html


What's been said:
Discussions found on the web: