Home Price Declines are slowly abating.
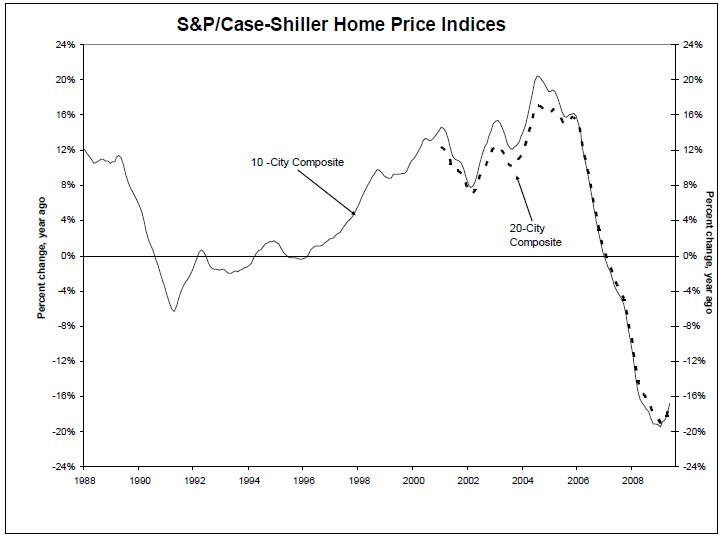
So says the S&P/Case-Shiller Home Price Indices. Data through May 2009 shows that the annual rate of decline (2nd derivative) improved for the fourth consecutive month in 2009.
The year over year data is still negative, but less so:
>

Source: Standard & Poor’s and Fiserv
>
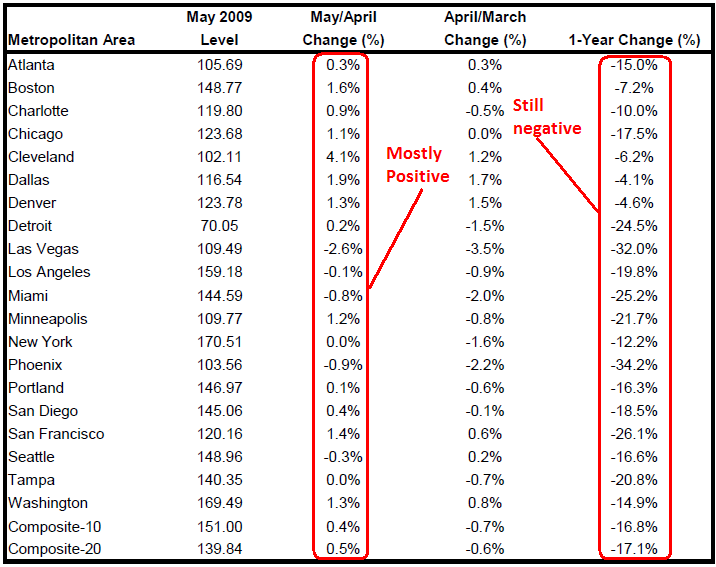
In terms of annual declines, the numbers remain relatively somber with all metro areas and the two composites in negative territory, and 16 out of the 20 metro areas are reporting double digit declines.
There were marginal improvements in the [NSA] monthly data [UPDATE: This was NOT Seasonally Adjusted]. This is the first time this has occurred in 34 months:
Annual versus Monthly Changes:

>
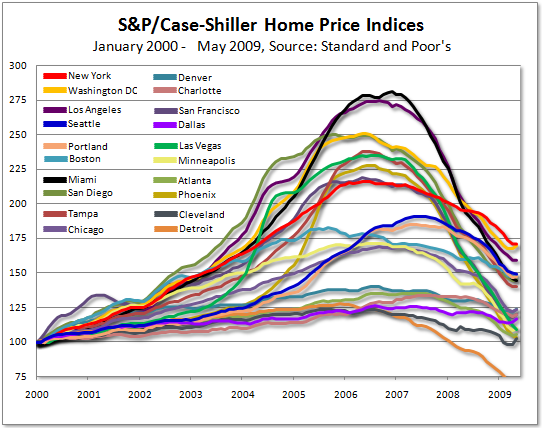
Here is the breakdown of all 20 regions

via Tim Iacono, The Mess That Greenspan Made
>
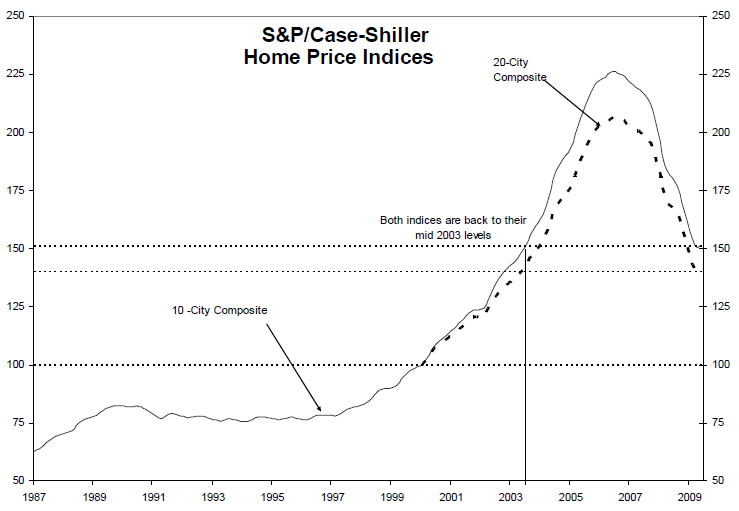
Prices have now returned back to mid 2003 levels:>

Source: Standard & Poor’s and Fiserv
>
Source:
S&P/Case-Shiller® Home Price Indices
http://www2.standardandpoors.com/portal/site/sp/en/us/page.topic/indices_csmahp/0,0,0,0,0,0,0,0,0,2,1,0,0,0,0,0.html


What's been said:
Discussions found on the web: