Yesterday, we discussed why the Case Shiller Index, which fell 18%, was not yet cause for celebration.
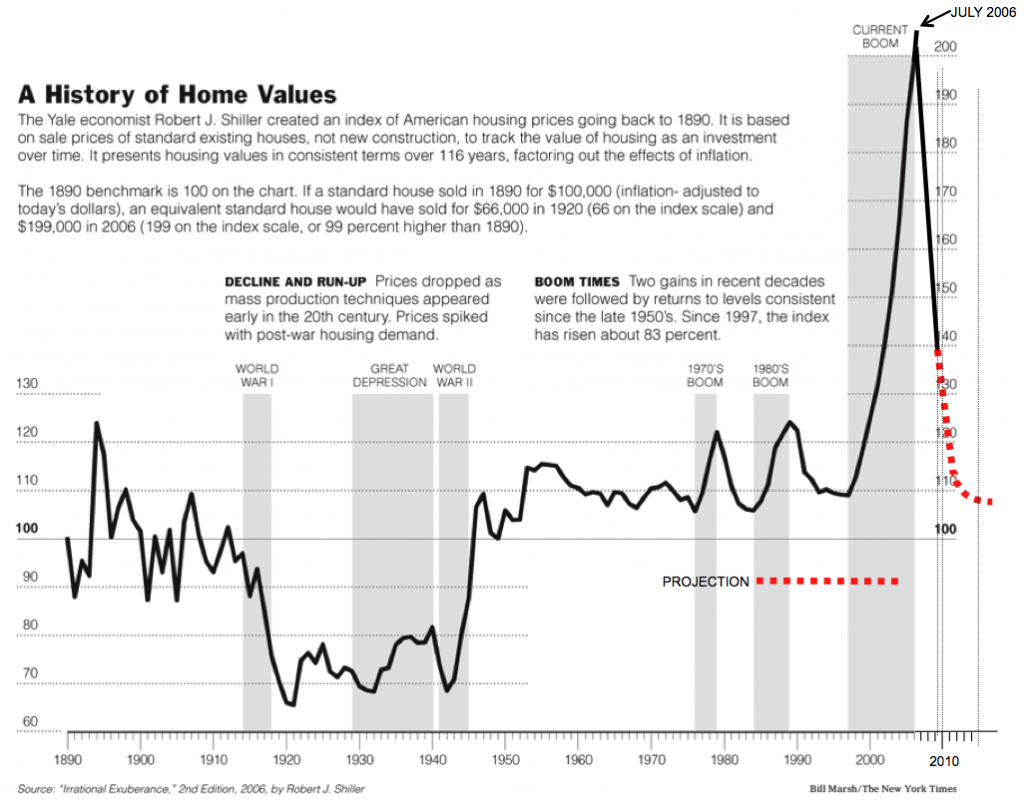
Regular TBP reader Steve Barry created this chart last year which projected forward the ongoing losses for Case Shiller; We first ran this back in December, and it ran all over the internet (mostly without attribution).
Well, its time to update this. Here is Steve’s most recent version:
>

Chart courtesy of the NYT, as modified by Steve Barry
>


What's been said:
Discussions found on the web: