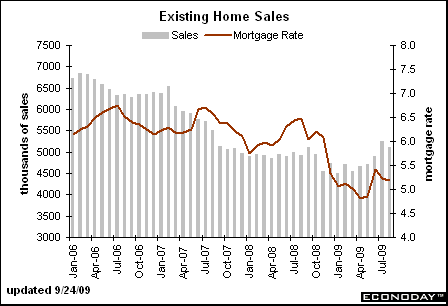
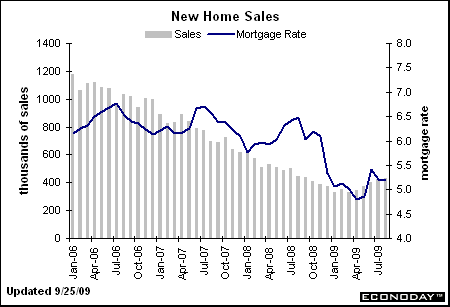
 Both Existing and New Home Sales disappointed economists this week. had they been savvier observers of Housing Markets, they should not have been surprised.
Existing Home Sales declined 2.7% month over month. They improved 3.4% above the August 2008 levels, as the national median existing-home price fell to $177,700 in August — down 12.5% from year ago levels.
 New Home Sales also disappointed — coming in at 0.7% gain from the prior month, about half of consensus expectations. Again, sales disappointments took place despite a record drop in prices. Median new house price dropped 9.5% in August from July — the biggest decrease since records began in 1963. New Home Sales were off 3.4% from a year earlier, as prices fell 12% from August 2008.
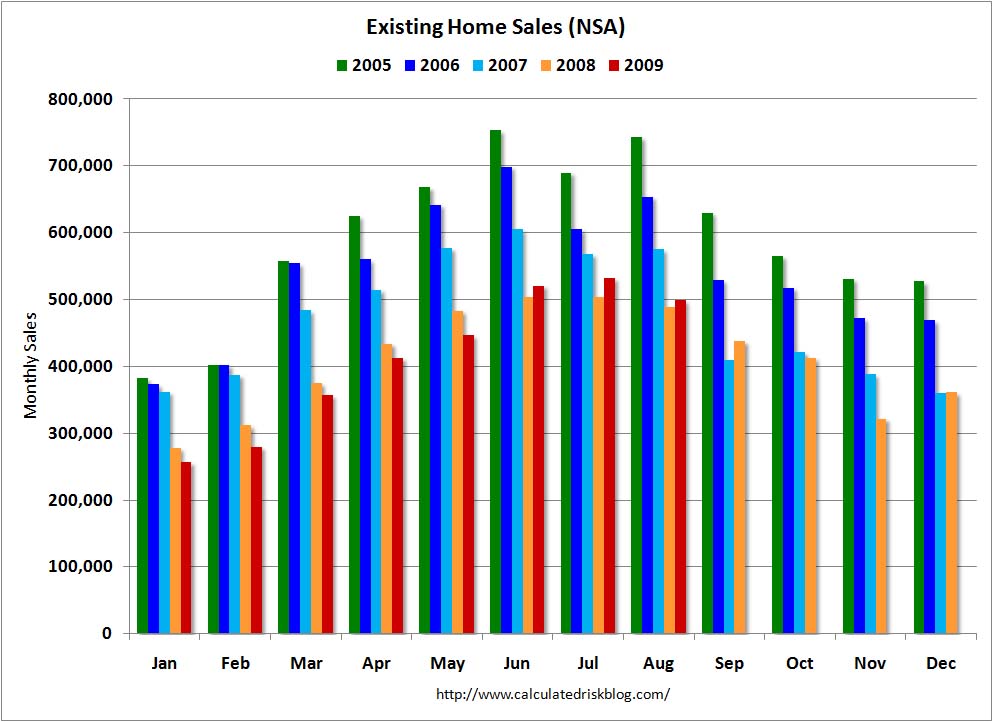
Why? Start out with the end of the Tax Credit for First time home buyers — that sunsets November 30th. Given that most mortgage commitments are only 90 days, the August buyers of new (but already built) homes should make it. Then we move on to the Seasonality issue: With the heart of the Spring/Summer sales season behind us, experienced real estate folk know that (month over month) home sales are heading back down. Sales bottom every year in January, pick up throughout the spring, and peak in July/August. Then, begin to slide until January (see chart below).
For sheer entertainment value, you can do no better our all time favorite spinmeisters, the National Association of Realtors. They had the best excuse for why August sales faltered: According to their chief economist, Lawrence Yun, the problem was (brace yourself for it) a “rising numbers of contracts entering the system, with some fallouts and a backlog contributing to a longer closing process.”
You see, real estate is booming, and there have been so many sales, the entire system is backed up! WE SIMPLY CANNOT CATCH UP ON ALL THE PAPERWORK. (One has to conclude that to work at the NAR requires a unique combination of chutzpah and stupidity; they seem to have both in spades).
One last curiosity about recent sales: Despite the record drop in prices, sales continue to flatten out after several months of strong increases. Beyond the seasonal observations, consider the implications of such weak sales accompanying a “record drop” in prices. That suggests that 1) demand is not strong; 2) credit for purchases is limited in availability; 3) prices are still too high; 4) all of the above.
So to conclude: Sales have stopped free-falling year over year; The were improving, in part due to foreclosure driven bargains, and in part due to first time tax credits. We now enter the weakest stretch of the year for monthly sales — expect them to continue sliding until January . . .
>
click for ginormous chart
Chart via Calculated Risk
>
Sources:
NEW RESIDENTIAL SALES IN AUGUST 2009
SEPTEMBER 25, 2009 AT 10:00 A.M. EDT
Manufacturing and Construction Division
http://www.census.gov/const/newressales_200908.pdf
Existing-Home Sales Ease Following Four Monthly Gains
NAR, September 24, 2009
http://www.realtor.org/press_room/news_releases/2009/09/ease_four


What's been said:
Discussions found on the web: