For the past 42 years, Bob Bronson has applied a disciplined, analytical approach to understanding and forecasting capital markets and advising investment advisors. Through his rigorous analysis of capital markets and economic data and his background in mathematics and financial economics, he has developed a number of unique investment concepts and refined portfolio-management techniques that improve returns and lower downside-volatility risk. To learn more, read his BIO.
~~~
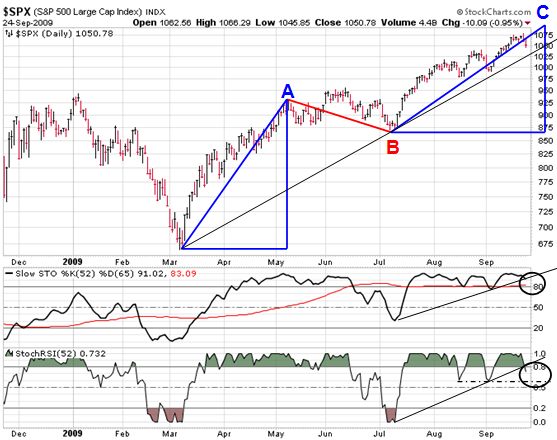
SPX has made a top very close to the power shortcut projection (magnitude times duration) for UVR as illustrated by the equal-area blue triangles, which is consistent with a completed Growth Cycle ABC pattern for the end of the “green shoots” rally since the Mar 6 intraday low.
More precisely, using integral calculus (for a discrete non-analytic function) the actual UVR of the C uptrend is 74% of that of the A uptrend, which is close enough to confirm a top if and when other necessary, but not necessarily sufficient, price-related indicators trigger, like the crossing of at least two of the three more black lines in the chart below.
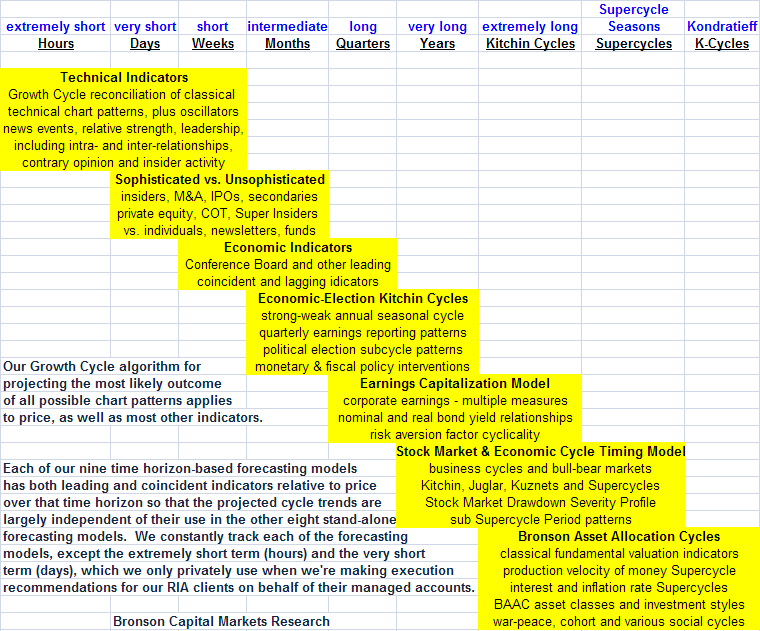
Of course, to make that call we also track many other proprietary and non-proprietary shorter term indicators as summarized in the table further below.
~~~


What's been said:
Discussions found on the web: