A few charts from Jake highlight the weakness in the Labor Market:
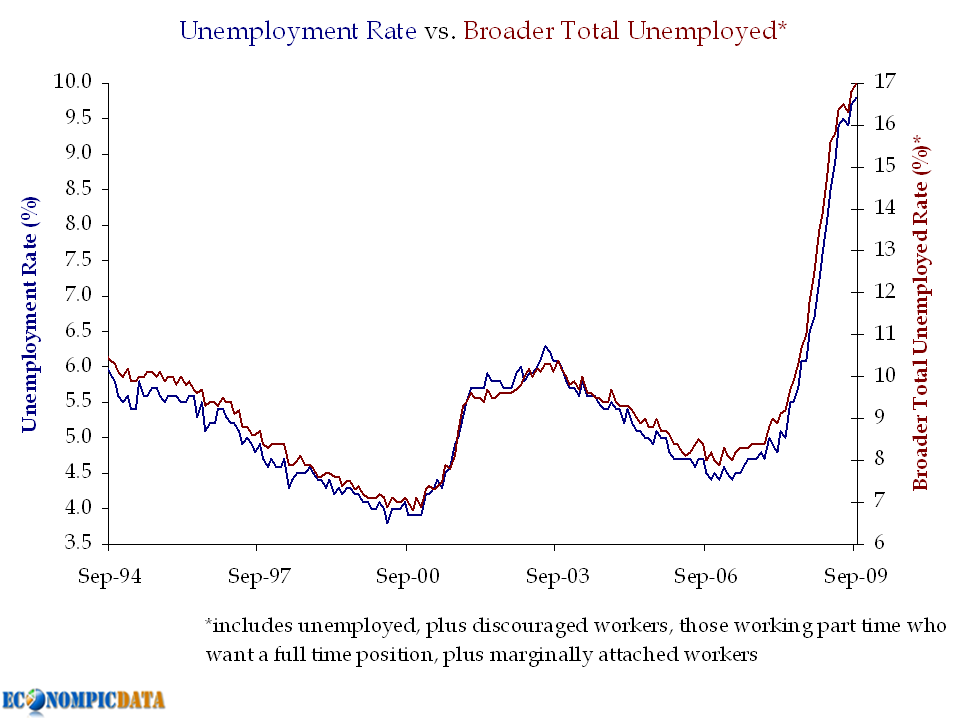
The broadest measure of Unemployment has now hit 17%
>
>
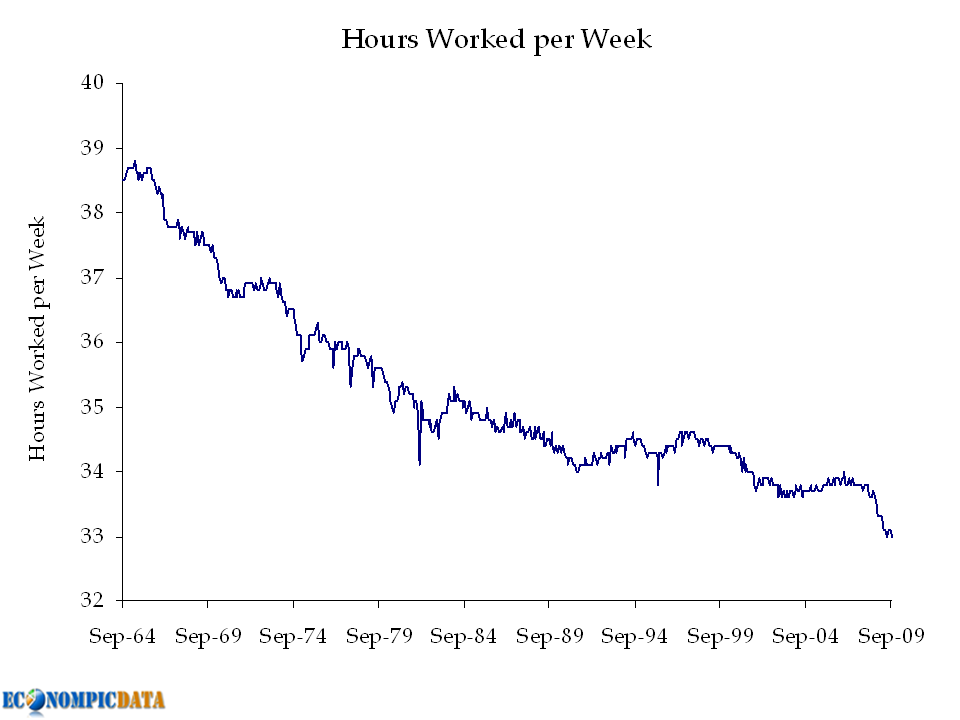
We continue to see hours worked look pretty ugly — this is not a positive sign, as it is a leading component of NFP.
>
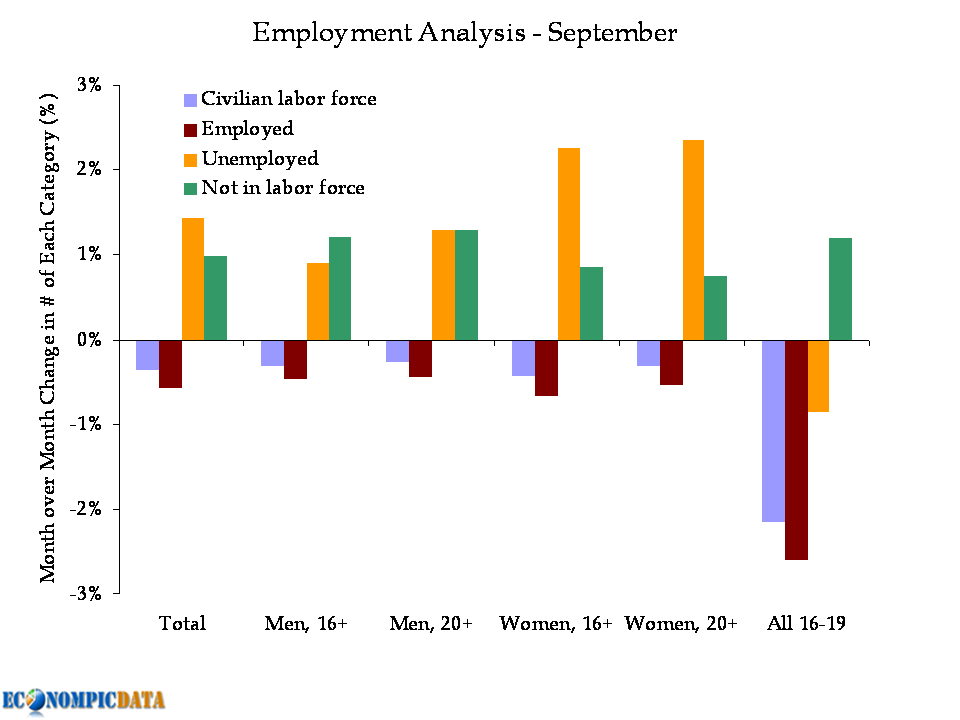
Lastly, I really like weird optical illusion with this one — it does not look like the X axis is perfectly horizontal . . .
>
Markets are about to open — gotta jump . . .


What's been said:
Discussions found on the web: