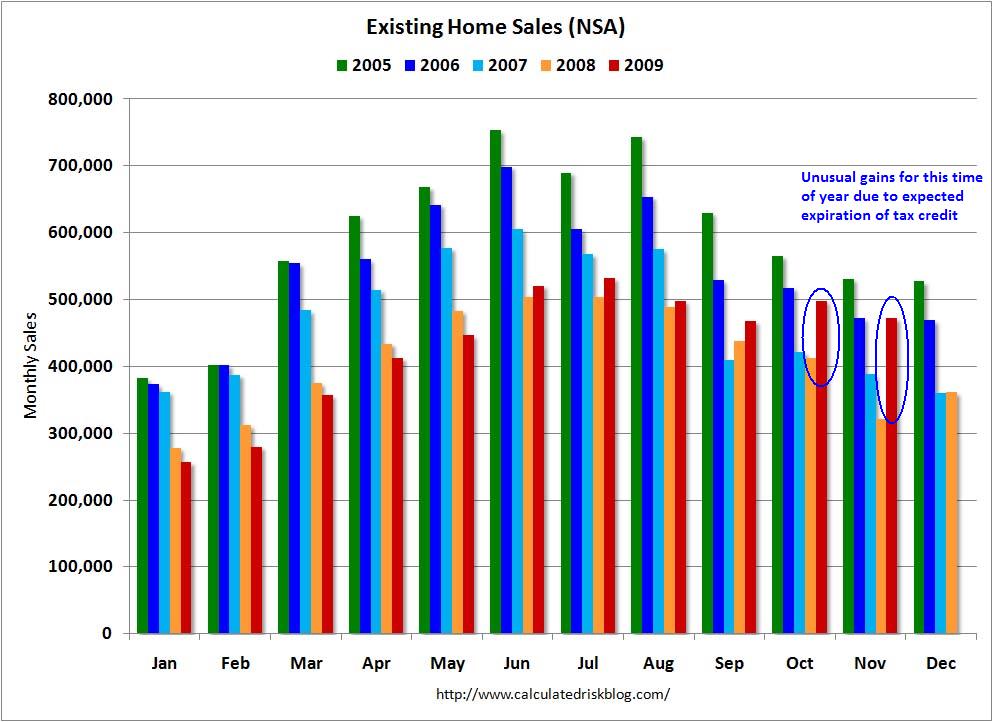
Here is a sign that things are artificially stimulated: Abnormally high Existing Home Sales for November 2009, pushing ginormous annual gains:
“Existing-home sales – including single-family, townhomes, condominiums and co-ops – rose 7.4% to a seasonally adjusted annual rate of 6.54 million units in November from 6.09 million in October, and are 44.1 % higher than the 4.54 million-unit pace in November 2008. Current sales remain at the highest level since February 2007 when they hit 6.55 million.”
Now granted, we are comparing the heart of the credit crisis, a very weak seasonal period one year ago, with the present sub-5% mortgages and the (expected end of) a government home buying credit.
Sales are up as prices continue to fall. Lower priced homes — especially Condo and Coop sales — were up a whopping 60% over last year.
While seasonal adjustments might have impacted the monthly data, the year over year numbers are simply off the charts.
Other data points:
-The national median existing-home price was $172,600 in November 2009, 4.3% below November 2008.
-Single-family home sales jumped 8.5% (SA annual rate) 5.77 million in November; Up 42.1% above November 2008.
-The median existing single-family home price was $171,900 in November, down 4.4%from a year ago.
-Distressed properties accounted for 33% of sales in November;
-First-time buyers purchased 51% of homes in November
-Total housing inventory at the end of November declined 1.3% to 3.52 million existing homes (6.5-month supply);
-Unsold inventory is 15.5% below year ago levels, and the lowest since April 2006;
-Existing condominium and co-op sales in November were unchanged monthly, but gained 60.1% from a year ago.
-Median existing condo price was $178,000 in November, down 3.1% from year ago levels.
Bottom line: Improving sales numbers, falling home prices, reduced inventory, distressed sales still driving the narrative.
Bill over at Calculated Risk notes that going forward:
• Months-of-supply will now increase sharply as sales plunge. Do not be fooled because months-of-supply is close to “normal” levels. This is primarily because sales were distorted by the tax credit.
• Excess inventory includes existing home inventory, rental units (vacancy at record high), and various shadow inventory. This is still near record levels.
• House prices are now falling again – and this will show up in the Case-Shiller index soon.
• This is probably the end of the “good” housing news for a while.
Here’s a NSA chart:
Chart courtesy of Calculated Risk (annotations mine)
>
Source:
Another Big Gain in Existing-Home Sales as Buyers Respond to Tax Credit
NAR, December 22, 2009
http://www.realtor.org/press_room/news_releases/2009/12/another_respond


What's been said:
Discussions found on the web: