As is the case every January, the financial media try to draw conclusions for the remainder of the year based upon the first few trading days. These studies are so popular that two phrases have been coined to describe them – “as goes the week, so goes the year” and, “as goes the month, so goes the year.” Do these adages have a basis in fact?
As Goes the Week . . .
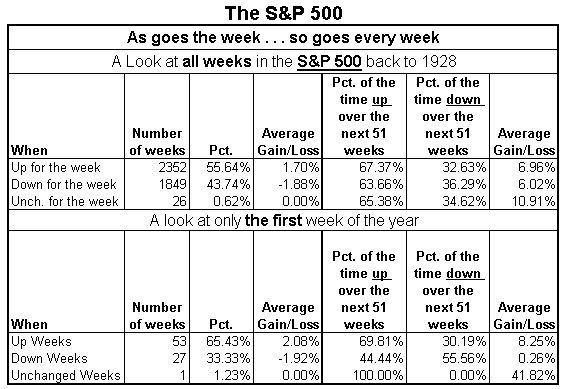
The table below shows the historical record of the S&P 500. We defined the first week of the year as the first 5 trading days in January.
The top panel of the table shows all weeks as a predictor of the following 51 weeks. The bottom panel shows the same indicator using only the first week of every year to predict the following 51 weeks.
Since 1928, if the S&P 500 is up the first week of the year, stocks are higher 51 weeks later 69.81% of the time. While that might sound impressive, the result is similar when using any week of the year. As the top part of the table shows, if the S&P is up on any given week, it is also up 67.37% of the time 51 weeks later.
The results are a bit more interesting when looking at down weeks in stocks. When the S&P 500 is down the first week of January, the next 51 weeks are up just 44.44% of the time. However, on the average down week, stocks are actually up 51 weeks later 63.66% of the time.
In essence, if stocks trade up in the first week in January, the following 51 weeks should not be considered any different than any other up-week in stocks and the ensuing 51 weeks. However, a down week in stocks during the first trading week in January is a bit different than, say, a down week in the middle of June. Since the S&P was up this week this indicator is offering no insight for the rest of the year.
As Goes the Month . . .
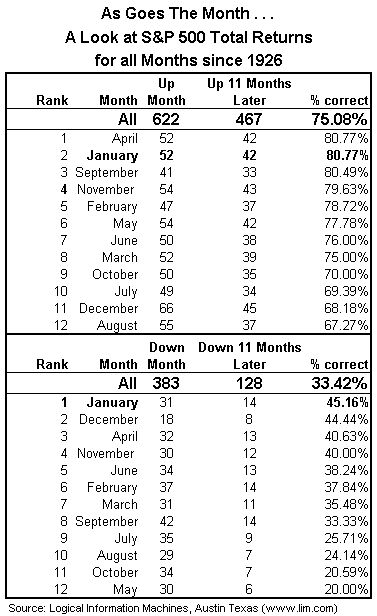
The other popular phrase often used by the media is “as goes the month, so goes the year.” We tested this adage in much the same way as above. We compared January to all months much like we compared the first week of the year to all weeks.
As the top panel of the table shows, January is no more predictive than many other months. If the month of January is up, the market is up 11 months later 80.77% of the time. While this may sound impressive, note that several months have a similar track record. Since all up months project positive returns 11 months later about 75% of the time, this suggests that the month of January is only slightly better than the average up month at predicting the direction of the market.
The bottom panel shows the results for the 11 months after a given month is down. If the month of January is down, the market is down 11 months later 45.16% of the time. While a down January ranks number one of all months in correctly predicting the direction of the market, it is no better than a coin toss in predicting the direction of the market 11 months later.
Conclusion
In this business all too often many rational people are willing to blindly accept as fact a quote or soundbite without verifying its accuracy. Because the first 5 trading days of the year were up in 2010, they should not be viewed any differently than any other positive week for stocks when being used to predict market direction 51 weeks later. It is only when stocks are down in the first week of the year that the market acts differently in the ensuing 51 weeks.


What's been said:
Discussions found on the web: