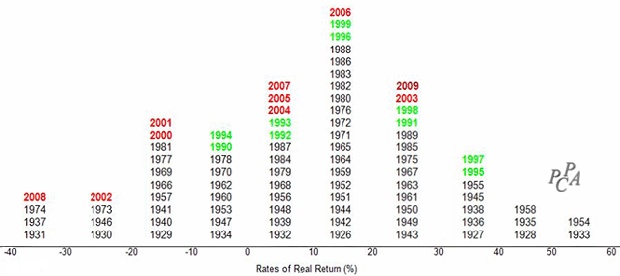
Following yesterday’s look at performance by years, Eric Willer in our Dallas office sent me these charts — they are quite instructive as to how markets have performed over various decades:
>
Annualized S&P500 Returns by Decade
>
Return History for Common Stocks 1926-2009 (inflation adjusted)
Average Annually Compounded Return = 6.7%

All charts courtesy of PPCA Inc.
>
Good stuff — thanks, Eric!
>
Source:
Perspectives on 2009 and Beyond (PDF)
Ron Surz
Horse’s Mouth, January 4, 2010
http://www.horsesmouth.com/panel/LinkTrack2.asp?http://www.ppca-inc.com/pdf/2009Perspectives.pdf


What's been said:
Discussions found on the web: