American Association of Individual Investors (AAII)
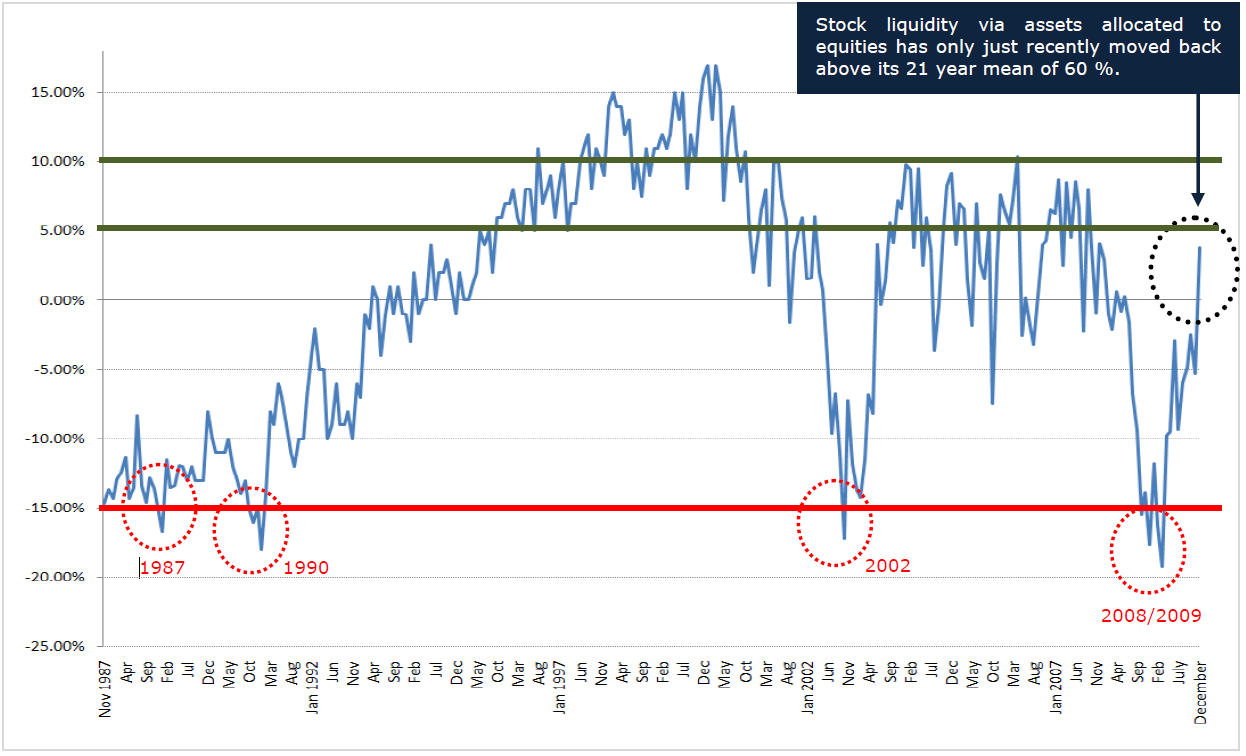
Equity Allocations, Deviation versus 21-Year Mean

chart courtesy of Fusion Analytics
>
Here’s my partner, Kevin Lane:
“As seen above in the chart above individual investor allocations to equities has only recently moved back above its 21 year mean allocation of 60%. The massive under allocation to equities in late 2008 into the 2009 low was one of the major reasons we became so bullish on stocks since it suggested that selling was washed out of the market and that massive liquidity (aka – buying power) was built up ready to buy back into stocks.
That said we have seen assets rotate back to equities over the last 10 months and the market, being a liquidity driven animal, has responded accordingly. Currently investors have only a slight overweight to equities at 4.00 % above the 21-year mean or stated another way investors are now 64.00 % allocated to equities versus the 21-year mean of 60.00 %.
This is one reason why we continue to believe that after a bit of a correction stocks can move higher as investor liquidity is still not tapped out yet.
While not as ample as near the lows buying power still remains adequate to power/move stocks higher and keep corrections fairly well contained.
-Fusion Analytics
~~~
UPDATE: As the title suggests, this is a Sentiment Review. It is based on a survey that AAII does, and we track changes as the oscillate around a historical mean.
There are two things to understand about this: When it reaches an extreme, it is a warning of an impending reversal; Second,it generally trends from one extreme towards the other.


What's been said:
Discussions found on the web: