Last month, we noted that the St. Louis Fed had declared in their charts that the recession was over (Dude, Where’s My Recession Bar?).
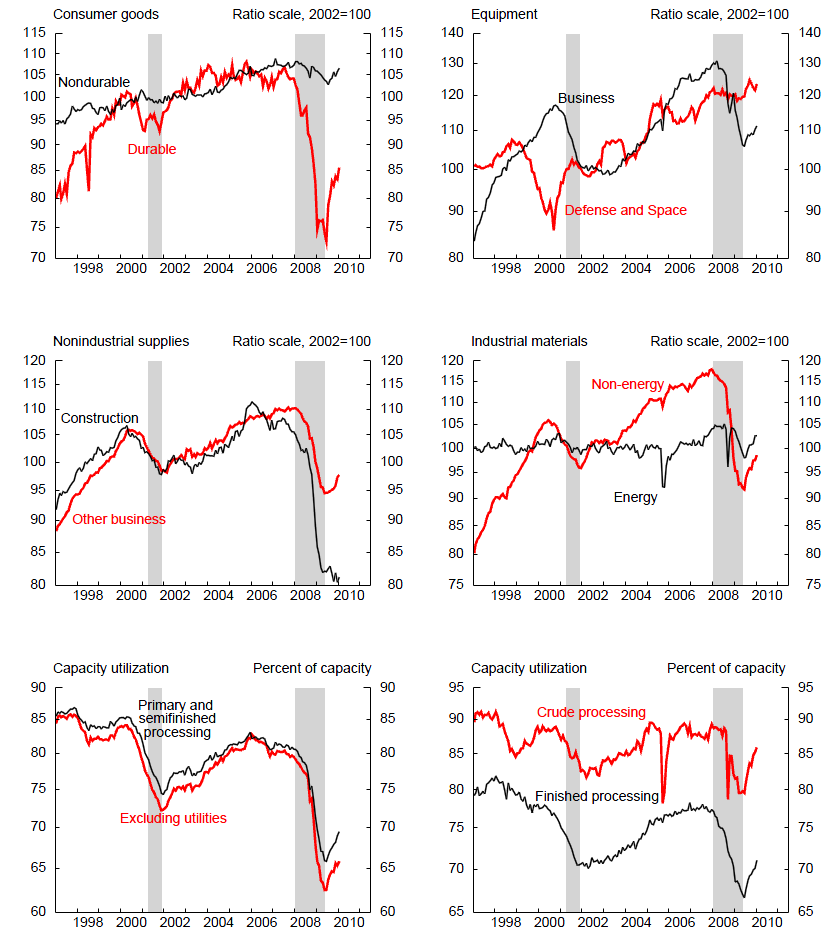
Now, it appears that with the latest G17 release on Industrial Production, the Federal Reserve is making the same assumption. They make note of this referring to several charts (below) stating:
“The shaded areas are periods of business recession as defined by the National Bureau of Economic Research (NBER). The last shaded area begins with the peak as defined by the NBER and ends at the trough of a 3 month moving average of manufacturing IP.”
They are referring to the technical definition of contractions (recessions) as starting “at the peak of a business cycle and end at the trough (as defined by the NBER).
Ron Griess observed the 3 month MA of the MANUFACTURING index:
| 12/31/08 | 101.5532 | 104.4655 |
| 1/31/09 | 98.781 | 101.6714 |
| 2/28/09 | 98.7251 | 99.6864 |
| 3/31/09 | 97.2599 | 98.2553 |
| 4/30/09 | 96.9201 | 97.6350 |
| 5/31/09 | 96.026 | 96.7353 |
| 6/30/09 | 95.6559 | 96.2007 |
| 7/31/09 | 97.2692 | 96.3170 |
| 8/31/09 | 98.4819 | 97.1357 |
| 9/30/09 | 99.108 | 98.2864 |
| 10/31/09 | 99.0424 | 98.8774 |
| 11/30/09 | 99.9374 | 99.3626 |
| 12/31/09 | 99.8848 | 99.6215 |
| 1/31/10 | 100.9264 | 100.2495 |
>
Hence, as the following charts reveal, the Fed is marking the Recession over as of Q2’s end, based upon industrial production bottom.
>
Industrial production, capacity, and utilization
Industrial production and capacity utilization
Hat tip Bob Dieli.


What's been said:
Discussions found on the web: