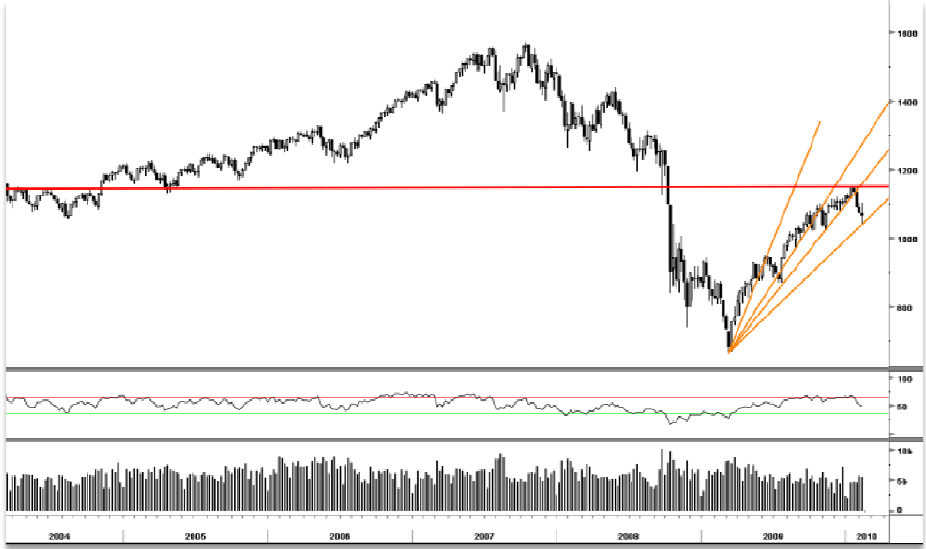
SPX Fibonacci Fan levels
Chart courtesy of Fusion Analytics
>
As seen above the S&P 500 Index tested and reversed off its lowest fibonacci fan trend line (orange lines) on Friday. This intraday reversal level of 1,044 came was starting to approach the support level of 1,037 we had called for several days ago and the reiterated on Thursday. However for the last two weeks it has rallied above but then fallen back below its downtrend line (red line).
While two weeks of stalling at resistance is not a major concern yet it does at very minimum raise a cautionary tone given the S&P 500 has had such a large, uninterrupted advance. Weekly momentum indicators are losing momentum and are close to flashing some sell signals, however until near term support is broken near 1,026 (blue line and arrows) it is hard to get too negative.
So to reiterate some yellow lights are flashing but the bottom line is the trend is up and remains intact and only a move below the 1,026 level would be viewed as a negative.
-Kevin Lane
~~~
Kevin Lane is one of the founding partners of Fusion Analytics, and is the firm’s director of Quantitative Research. He is the main architect for developing their proprietary stock selection models and trading algorithms. Prior to joining Fusion Analytics, Mr. Lane enjoyed success as the Chief Market Strategist for several sell side institutional brokerage firms. In those capacities he oversaw the firms’ research departments. He produced a broad range of widely followed institutional research publications ranging from industry specific notes to quantitative/fundamental reports on individual stocks. His buy side clientele consisted of many of the nations top money managers and hedge fund managers. Mr. Lane is a member of the Market Technicians Association.


What's been said:
Discussions found on the web: