Warning: Wonkiness ahead:
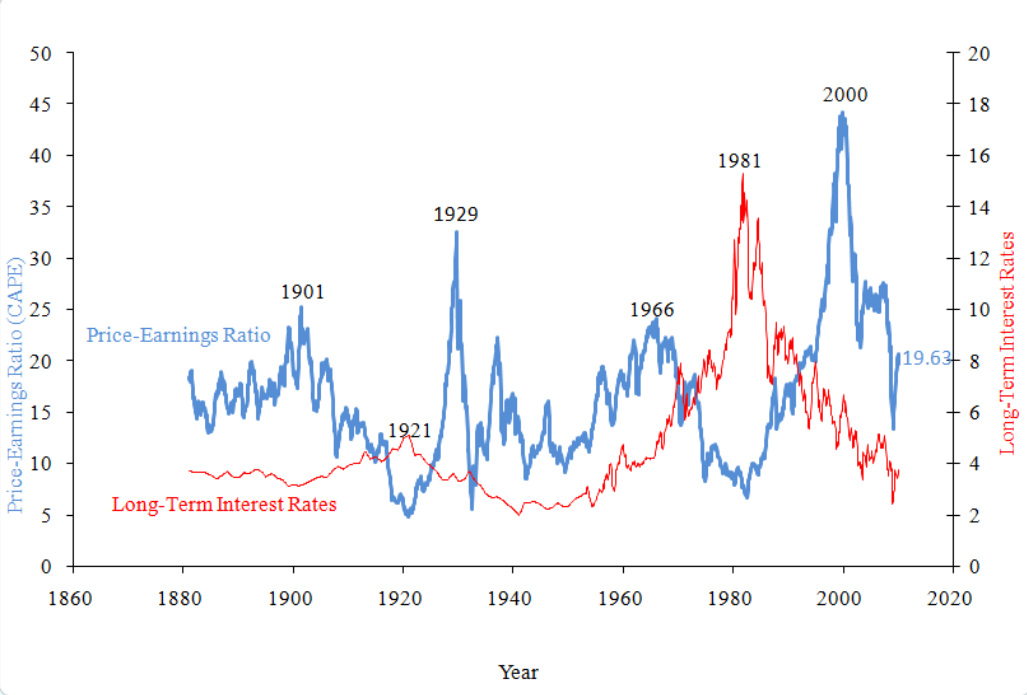
Chris Turner took a look at Yale’s Bob Shiller “cyclically adjusted price to earnings ratio” (CAPE). Shiller uses an inflation adjusted S&P 500 Index (using simple monthly CPI data). The professor then divides that a 10 year average of trailing earnings (similarly CPI adjusted) earnings.
Chris wanted to know what happens if we pull the Cycle out of the CAPE? (Chris’ paper is here).
Short answer: You end up with a long term chart of inflation adjusted SPX valuation that implies the market, by Shiller’s metrics, has been overvalued (i.e, “Not Cheap”) for a long time.
Chart 1: Long term P/E and Interest Rates

More charts, and the paper’s conclusion, can be found here.


What's been said:
Discussions found on the web: