For the past 42 years, Bob Bronson (BRONSON CAPITAL MARKETS RESEARCH) has applied a disciplined, analytical approach to understanding and forecasting capital markets and advising investment advisors. Through his rigorous analysis of capital markets and economic data and his background in mathematics and financial economics, he has developed a number of unique investment concepts and refined portfolio-management techniques that improve returns and lower downside-volatility risk. To learn more, read his BIO.
~~~
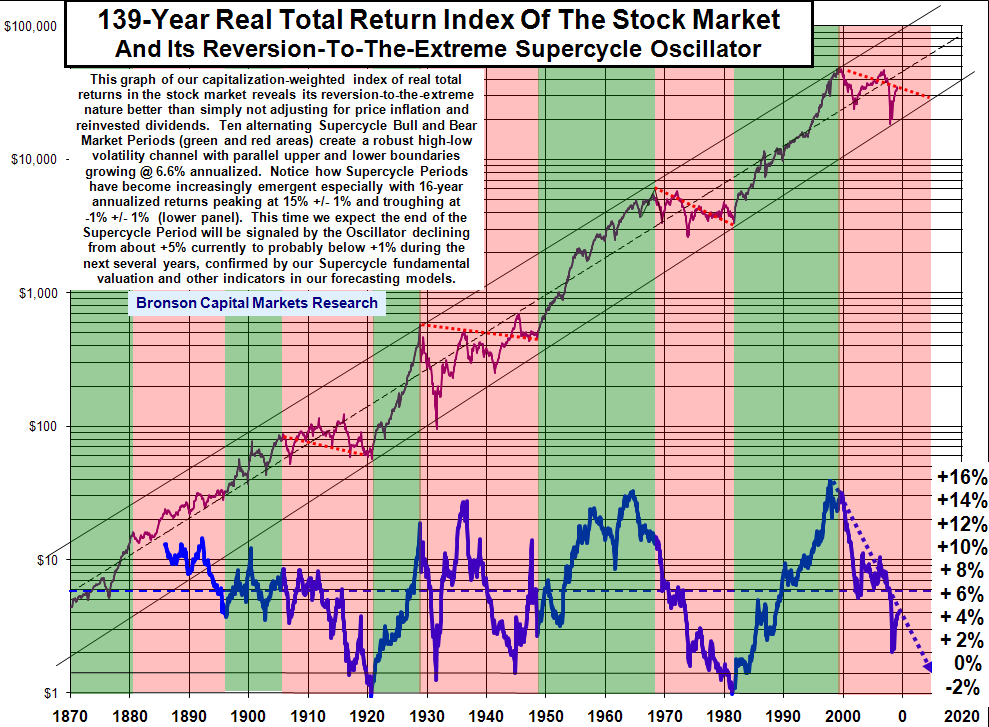
The Supercycle mean-reverting nature of the stock market is best revealed through its real total returns (that is, adjusted for price inflation and dividends reinvested), as illustrated in the chart below (See chart below).
The stock market’s performance over nine alternating Bronson Asset Allocation Cycle (BAAC) Supercycle Bull and Bear Market Periods (green and red shaded areas, respectively) create a robust high-low volatility channel, with parallel upper and lower boundaries showing growth of 6.6% annualized over the 139-year period.
Notice how Supercycle Periods have become increasingly emergent, as especially seen in rolling 16-year returns rather predictably peaking at 15% +/- 1% and troughing at 0% +/- 2% (see the lower panel of the chart), which further establishes 16 +/- 4 years as the average length of a BAAC Supercycle Period (Bull or Bear).
The S&P 500 index is currently at the same level as it was four to five months ago, 15 months ago and 12 years ago – that is, there are 0% gains over each of those periods, the latter of which especially has caused the 16-year Supercycle Oscillator to be approaching its predictable 0% +/- 2% trough.
We continue to expect the end of the current Supercycle Period (a Supercycle Winter, or deflationary Supercycle Bear Market Period) will be signaled by the Oscillator declining still further from about 5% at present to probably below 1% during the next several years, a forecast supported by our Supercycle fundamental valuation and other indicators in our forecasting models.
>
The monthly real total return index used in this chart is from our uniquely compiled capitalization-weighted index (CWI) of all exchanged-traded US common stocks which, along with several important enhancements explained below, splices the S&P/Wilshire 5000 Composite Index with a database going back to 1870 that is maintained by Yale professor of economics Robert Shiller: http://.econ.yale.edu/~shiller/data.htm.
Our CWI contains only common stocks, which currently comprise some 6,000 of the more than 10,000 securities currently traded on the NYSE, NASDAQ and ASE. It excludes the more than 4,000 non-common stocks, which would otherwise constitute statistically-distorting data that is duplicative or irrelevant.
Shiller’s database splices the Cowles Commission database from 1870 to 1926 with the high-quality, no-survivor-bias, CRSP database, as explained here: http://en.wikipedia.org/wiki/Center_for_Research_in_Security_Prices But instead of essentially smoothing data as Shiller does by using the average of daily closing prices during each month, we prefer not to smooth and instead to track very important mean-reverting bull-bear volatility. Thus, our CWI uses intra-month, cyclical bull- and bear-market high and low prices, identified in exhibit E: http://www.financialsense.com/editorials/bronson/model.pdf, which we substitute for month-end prices for the S&P 500 Index since Dec 1949 and for the S&P Wilshire 5000 Composite Index since Apr 2001.
Further, in order to capture as much meaningful price volatility as reasonably possible for the even earlier monthly data prior to 1950, we’ve replaced Shiller’s monthly averaged data with Dow Jones Industrial Average intra-month cyclical bull- and bear-market high and low prices going back to its first availability in 1896: http://www.djaverages.com/index.cfm?view=industrial&page=reports&show=performance&symbol=DJI
All of this spliced, expanded and more refined monthly CWI data is further enhanced by presenting it as a real total return index, which reveals Supercycles better than more popular presentations that do not adjust for either dividends or price inflation.
Subscribers to our private list may request a fully detailed and easy-to-maintain spreadsheet of the 139-year price-only, nominal-total-return and real-total-return history of our monthly CWI index, not otherwise available, for their private, non-commercial use.


What's been said:
Discussions found on the web: