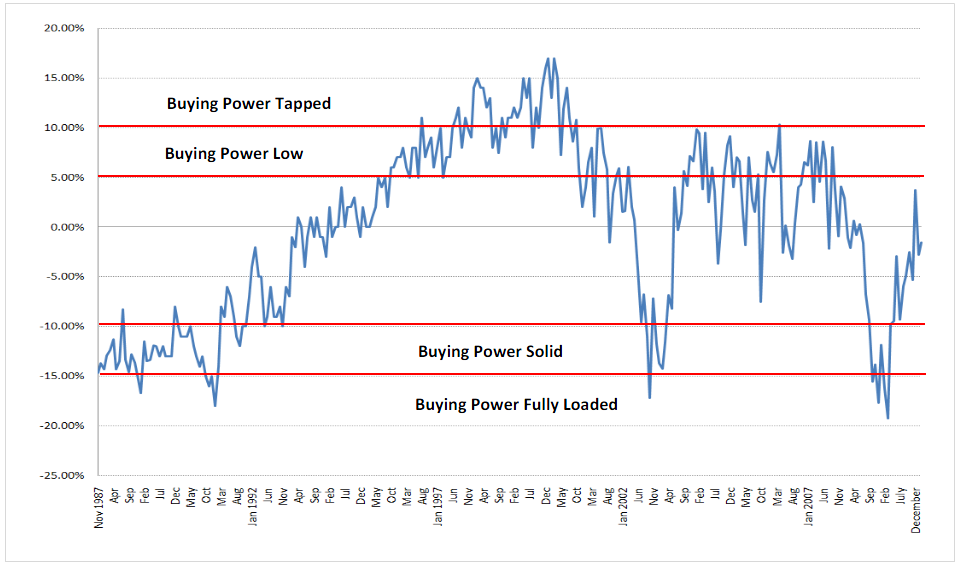
AAII Asset Allocation Survey – Equity allocation % deviation from 23yr. mean (Monthly Chart)

chart courtesy of FusionIQ
>
Liquidity is a powerful tool. Given liquidity goes hand in hand with sentiment liquidity tends to be at its highest when equities are at their lows and investor sentiment is extremely dour; conversely liquidity tends to be at its lowest when stocks are at their highs and investors are exuberant.
As seen above the recent correction saw equities get almost back to a 5.00 % allocation above the mean allocation, typically this is an area vulnerable to shallow corrections. Hence it was not a surprise to see a minor pullback recently.
Currently individual investor allocations toward equities is slightly below the mean, which puts us in a zone where though reduced, buying power is still somewhat ample. With buying power relatively strong and the AAII Bull Sentiment Survey still at a relatively neutral reading it’s hard to see a big correction here.
What may be a likely scenario is as follows: the market continues to move up and investors, even the non believers, become triggered to chase stocks, putting their last bit of buying power into the market.


What's been said:
Discussions found on the web: