 Here is a fascinating piece of investing arcana — from the St. Louis Fed FRASER archives.
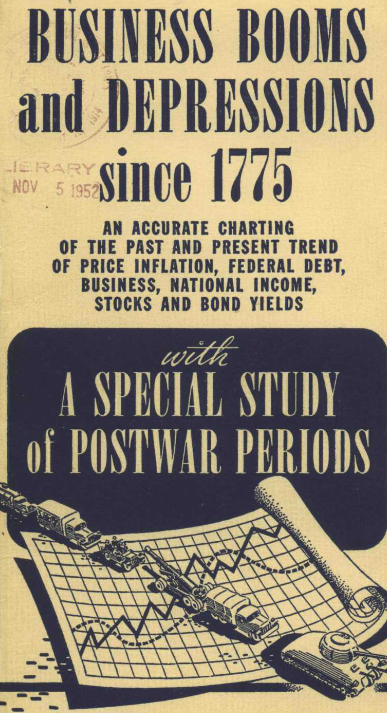
A history of booms and busts from 1775- 1944. Emphasis is on post war economies. As described by the paper:
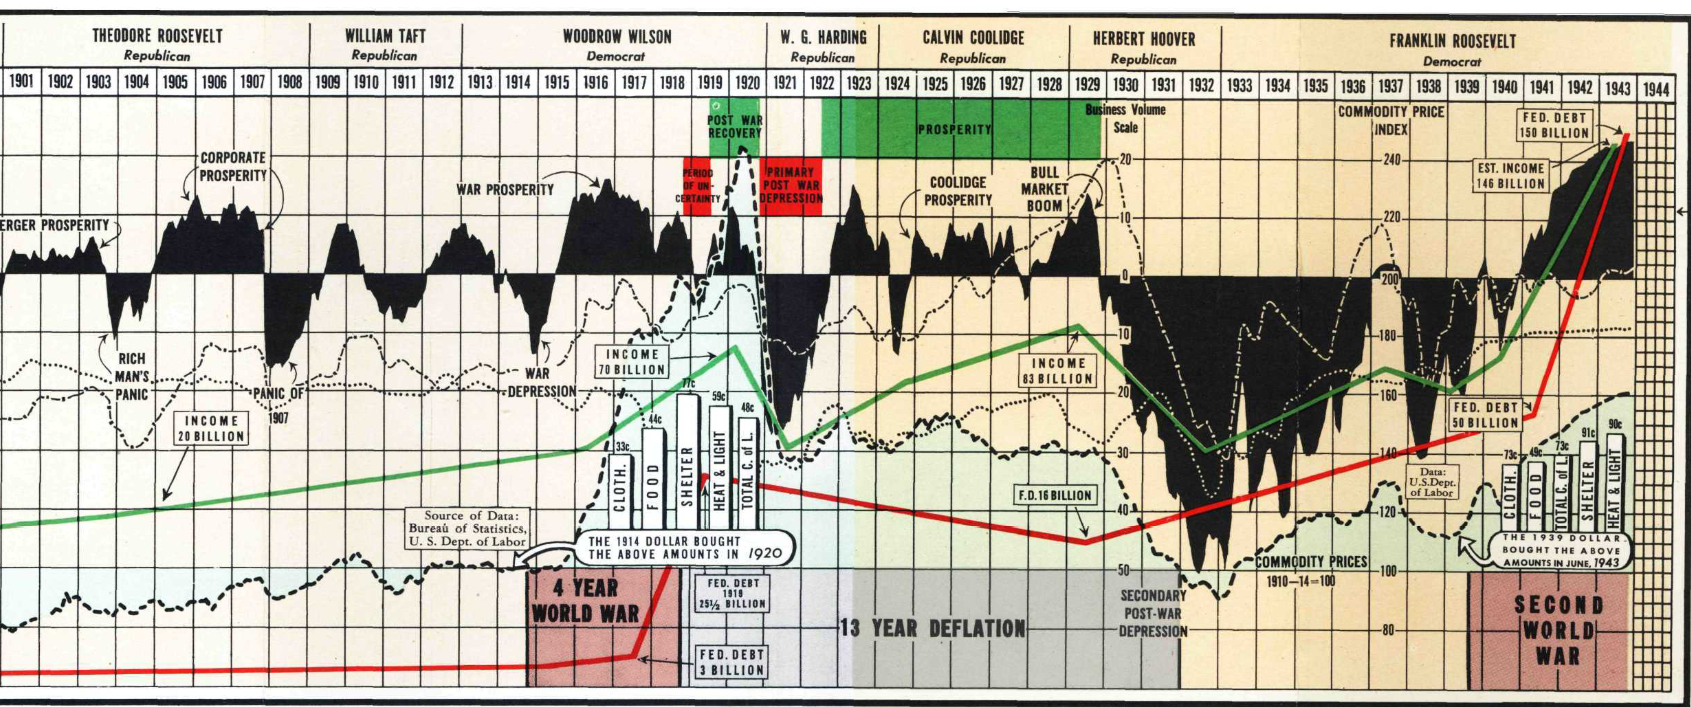
A study of the reaction of business activity immediately following previous wars can, in a measure, act as a partial guide to the future — at least avoid a hasty step into the unknown. The general pattern of these reactions is outlined in this chart by the Red or Green squares which block out and high light the trends that have followed previous major wars.
These diagrams indicate a more or less definite pattern of reaction that points up as follows: first, a brief period of uncertainty, then a year or more of business recovery followed by a short depression; then a period of prosperity extending over several years.
Summing up a comparison of these postwar years we find that they cover a space of from eight to ten years each, showing less than three years of business recessions and an average of 7 years of prosperity.
The chart is quite complete and astonishing — rather than attempt to show the entire 170 year time line, here is a about a quarter of it:
>
>
Hat tip Invictus
You can download the PDF here.


What's been said:
Discussions found on the web: