
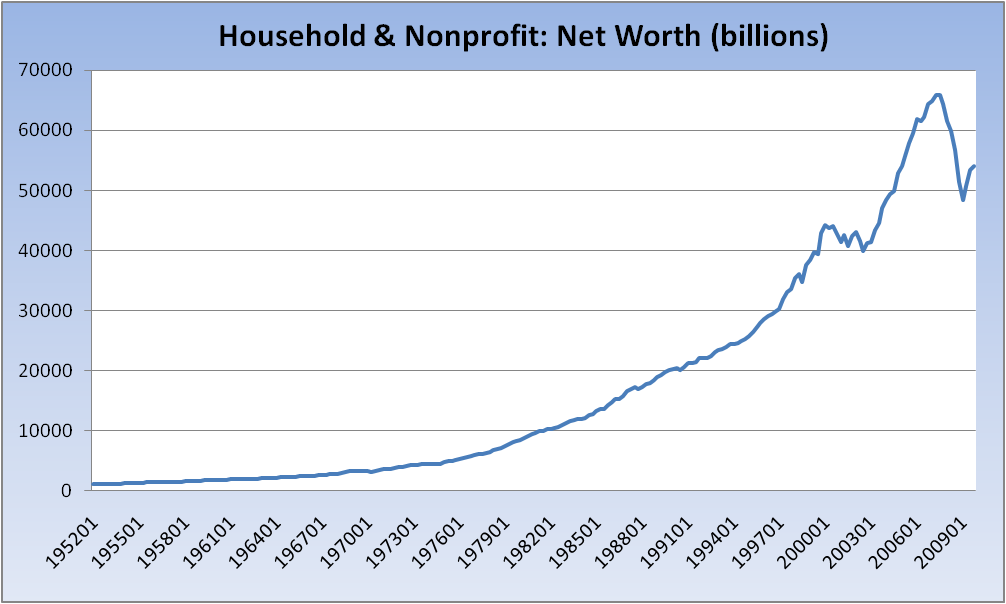
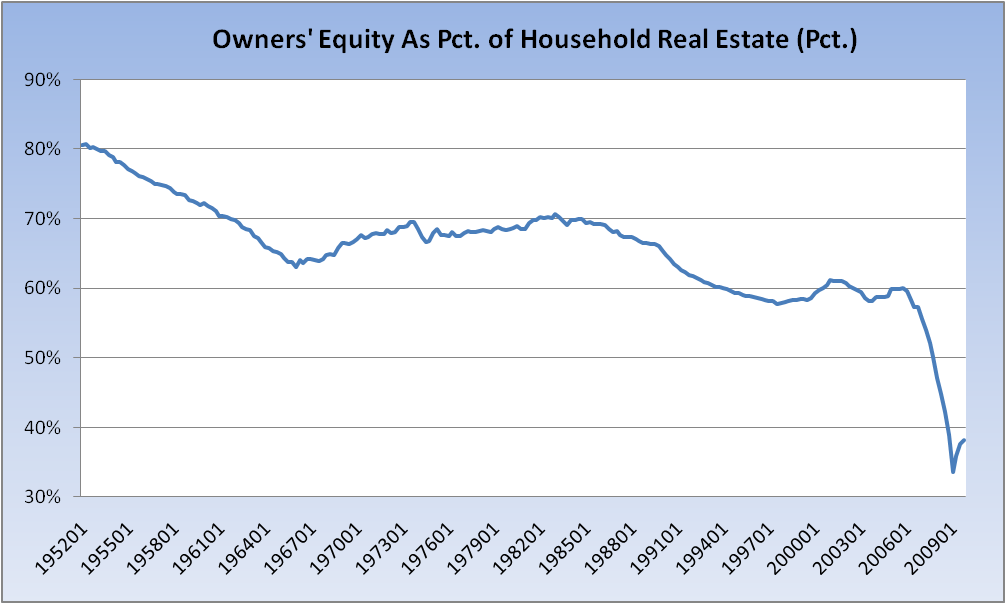
The Fed’s Flow of Funds report was released at noon, and showed a continuing healing of the household balance sheet: Assets grew, liabilities shrank, so Net Worth improved. Debt-to-income continued to decline (now 127%) from a peak of 136% (still much work to do here). Even Owners’ Equity as Percentage of Household Real Estate continued its rebound off a hideous 34% bottom about one year ago. (That chart, to my eye, really encapsulates all that went wrong; it’s a picture that really is worth 1,000 words.)
Here’s the down and dirty:
>

The trendline for Debt-to-Income is at about 114% which, absent rising Personal Disposable Income, implies a need to shed an additional $1.5 trillion in liabilities.
A (bullish) wirehouse has come out with some observations, among them this troubling nugget:
Household assets rose 1.0%, or $657 billion, to $68.2 trillion. The rise in assets was driven entirely by financial assets – the continued recovery in the equity market. Household equity assets rose 4.6%, or $534 billion, to $12.1 trillion. Meanwhile, in a sign that the recovery in home prices may have run out of steam, the value of real estate assets fell 0.3% to $18.2 trillion.
I do not find it at all heartening that the “rise in assets was driven entirely by financial assets,” as it goes without saying that leaving our collective fate to the whim of the markets can prove a bit problematic (see: 2008). It’s also disheartening — though certainly no surprise — that “the recovery in home prices may have run out of steam.” And that’s coming from bulls!
If time allows, I’ll take a deeper dive into the report. It is always chock full of goodies and among my favorites to dig into.

What's been said:
Discussions found on the web: