David A. Rosenberg is Chief Economist & Strategist at Gluskin Sheff, with a focus on providing a top-down perspective to the Firm’s investment process. Mr. Rosenberg has earned both Bachelor of Arts and Master of Arts degrees in Economics from the University of Toronto. Prior to joining Gluskin Sheff, David was Chief North American Economist at Bank of America-Merrill Lynch in New York and prior thereto, he was a Senior Economist at BMO Nesbitt Burns and Bank of Nova Scotia. Mr. Rosenberg has ranked first in economics in the Brendan Wood International Survey for Canada for the past seven years and was on the U.S. Institutional Investor All American All Star Team for the last four years.
>
After an 18-month period of unprecedented fiscal, monetary and bailout stimulus, it is completely legitimate to pose the question: why is the yield on the 5-year T-note sitting below 2%? (Not to mention a record low 0.769% two-year note yield at yesterday’s auction.) Is that consistent with a V-shaped reflationary recovery? And, wasn’t the Fed so convinced just a few months ago that the recovery was going to be entrenched enough to allow the central bank to start to shrink its pregnant balance sheet? If so, then why is it that since March, the Fed’s balance sheet has expanded a further $50 billion, and all with extra mortgage backed securities?
Maybe, just maybe, the recovery is more fragile than many believe — though we must admit that the minutes from the last FOMC meeting were filled with talk of downside risks to the economic outlook. The vagaries of life in a post-bubble credit collapse.
We know that there are many pundits talking about how great the U.S. consumer has been doing (funded by a renewed but unsustainable decline in the savings rate) and how employment has begun to improve. Dude — as the credit crunch was just getting started in the fall of 2007, the three-month trend in retail sales was running at a 6% annual rate and payrolls were still rising at around a 100k monthly pace. What good does it do to focus on numbers that look through the rear-view mirror — focus on the credit markets, which drive looking through the front window. They tend to lead.
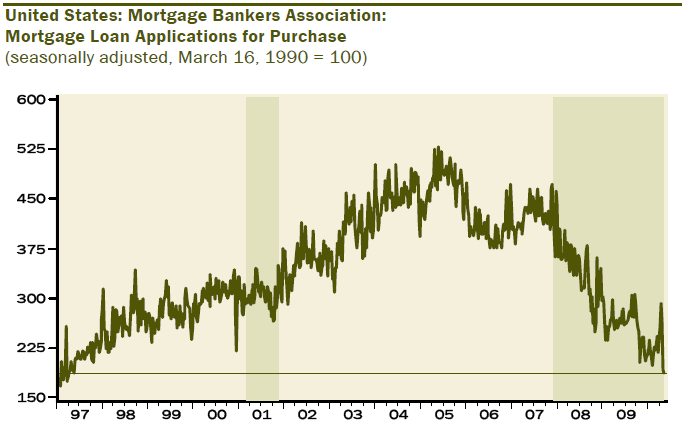
Finally, it is amazing and disturbing at the same time to see mortgage applications for new purchases decline 3.3% during the May 21 week, this is on top of the massive 27.1% slide the week before. So far in May, this proxy for new housing demand has absolutely cratered at a 99.96% annual rate (yes, that’s correct) even though mortgage rates have come down by nearly 25bps. And, as we highlight below, homebuying intentions are moribund despite all the government efforts to turn the residential real estate sector around. It has become abundantly clear that consumer attitudes towards homeownership and indebtedness have been semi-permanently ruptured in the aftermath of the horrible deflation and default experience of the past two years.
Mortgage Applications for new purchases at a 13-year low

Shaded region represent periods of U.S. recession.
Source: Haver Analytics, Gluskin Sheff
NICE LATE-DAY RALLY, BUT ….
There really isn’t a whole lot to be bullish about. Nothing is really oversold technically. Certainly sentiment is not washed out. The S&P 500, for the first time since the bear market rally began, has sliced below all the long- and intermediate-term trend lines. The 50-day moving average has actually morphed from merely peaking out to now rolling over; and the index has sliced seriously below the 200-day m.a., which is a sign of serious rupture. The same can be said, by the way, about oil, copper and the 10-year note yield — though we must admit that 4% is acting as a key source of resistance for the long bond.
CAN WE EXPECT A 30-40% CORRECTION?
There have only been two other times when the stock market ran parabolically up from a low in barely over a year, as was the case this time around (+80% from March 2009 to April 2010): the 112% surge from June 1, 1932 to September 7, 1932; and the 116% runup from March 2, 1933 to July 18, 1933. In the first case, we had a 40% correction and in the second, the correction was 34%. So, we are talking here about the prospect of a pretty hefty reversal in the S&P 500 that could very easily take the index down to as low as 850, if the history of these types of givebacks is any indication.
The problem for Mr. Market is that it went into this latest Europe-induced ordeal with an excessively bullish GDP growth outlook for the U.S.A. – at the April highs, we would argue that a GDP growth rate of 6% was effectively being discounted. How nutty is that?
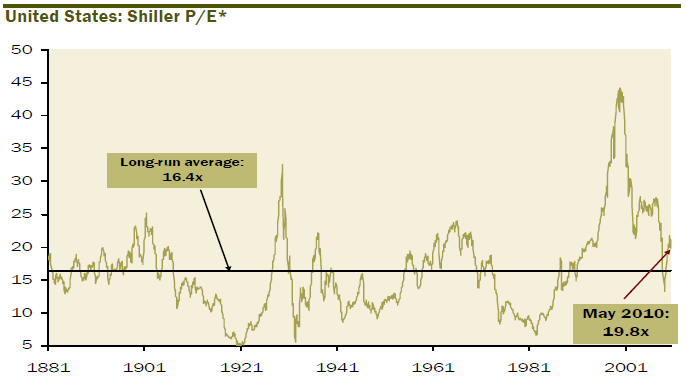
In the aftermath of the correction, the equity market is now pricing in a growth rate closer to 3.5% — the fact that earnings have been rising while the market has been correcting has helped cut the degree of overvaluation in half, to a 0.5 standard deviation from 1.0 just over a month ago on a Shiller normalized P/E ratio basis. But the ECRI leading economic index is actually foreshadowing a deceleration in real GDP growth, to 1.5% in the second half of the year from the 3.75% average pace since the recession technically appeared to have ended around mid-2009. The S&P 500 level that would be consistent with that sort of pace would be closer to 850 than the current level of 1,074. In other words, there is still more air to come out of the balloon.
SHILLER P/E — MARKET OVERVALUED BUT LESS SO
One of our favourite equity valuation measures, the Shiller P/E ratio, slipped to 19.8x in May from a cycle-high 21.8x in April (the Shiller P/E uses the 10-year average of inflation-adjusted earnings). Even still, this metric suggests that relative to the long-run, which spans to the 1881, the market is overvalued by about 20% compared to over 30% in April. If history is a guide, when the Shiller P/E is at these levels, the 10-year annualized total return of equities is just over 5%. Page
SHILLER P/E — MARKET OVERVALUED BUT LESS SO

*Shiller’s P/E uses the 10-year average of as reported earnings. Both earnings and prices are inflation-adjusted
Source: Robert Shiller, Gluskin Sheff
~~~
Founded in 1984 and focused primarily on high net worth private clients, Gluskin Sheff [2] is dedicated to meeting the needs of our clients by delivering strong, risk adjusted investment returns together with the highest level of personalized service. The minimum investment required to establish a client relationship witjh Canadians with the firm is $3 million, and for US and International is $5 million.
For almost 25 years, Gluskin Sheff [2] has pursued investment strategies that set us apart from other investment firms and currently manages investment strategies across equity, alternative and fixed income asset classes. Managing risk and ensuring adequate diversification are hallmarks of our investment philosophy. Customized investment plans are tailored around individual and evolving client needs.
“Our mission is to be the pre-eminent wealth management firm in Canada serving high net worth investors”


What's been said:
Discussions found on the web: