Late last month we noted that stock volume was soaring. We said:
Since April 7 the S&P 500 is nearly unchanged. An uptick in volume in a market that moved from a strong uptrend to no trend is what technicians call a “distribution pattern.” It suggests those who held stocks during the [year long] rally are “distributing” them to new players. Often these players are weaker hands, meaning they are looking for short-term gains and would quickly exit should the market turn lower.
This story is getting more interesting and an update is in order.
Distribution Continues
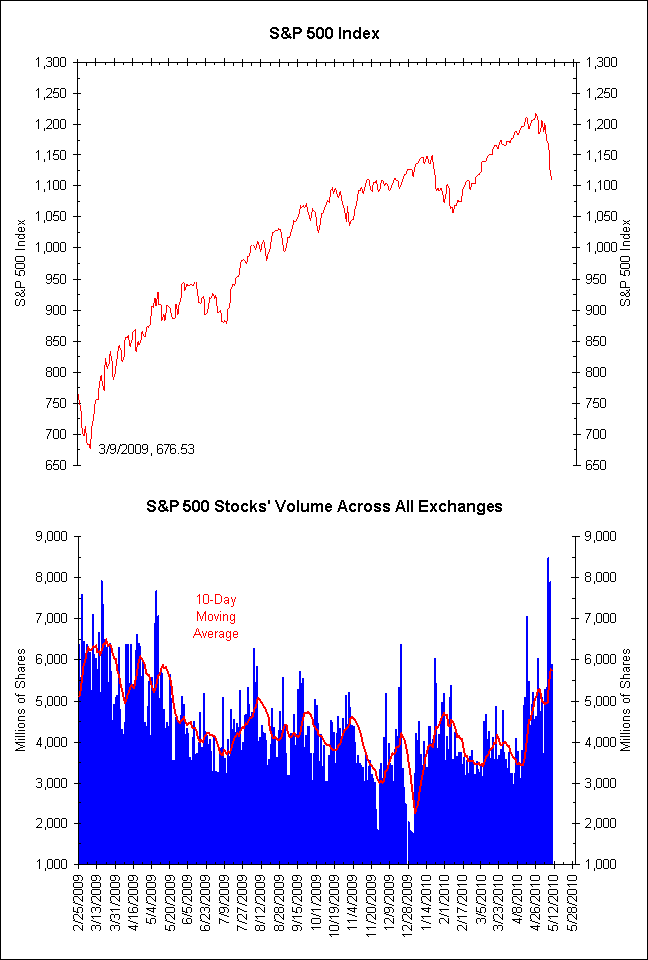
The chart below is an update of the same one we used last month. It shows the volume of the 500 stocks in the S&P 500 across all exchanges (composite volume). The blue bars in the second panel show daily volume while the red line shows a rolling 10-day average.
As the 10-day average shows, volume has been spiking in recent weeks. At 5.8 billion shares/day, the 10-day average is at its highest level since April 2009.
As the blue bars show, last Thursday and Friday were the highest volume days since the dark days of the credit crisis in late 2008.
The message is clear, volume reversed its slow slide this past March and is now spiking higher. This is the first time we have seen a volume spike since the March 2009 low.
<Click on chart for larger image>
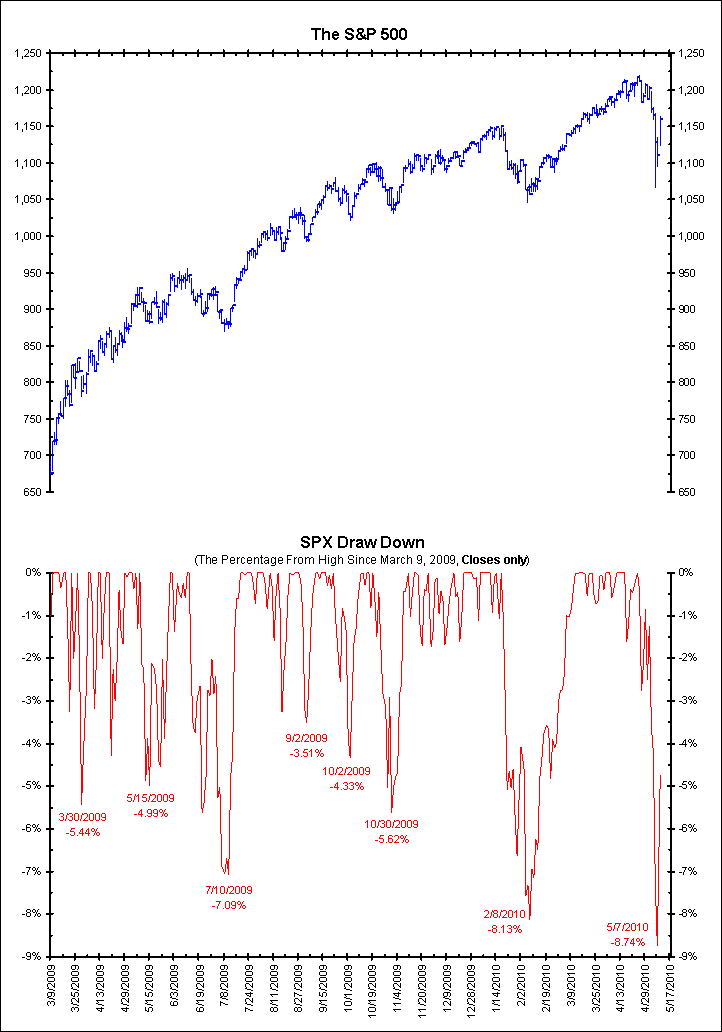
As the next chart shows, the current volume spike coincides with the biggest correction and most volatility since the March 2009 low (-8.74% correction through May 7). Note that the stock market had a similar correction in early February (-8.13%), but that occurred on low volume. This one, however, is occurring on spiking volume. The volume difference makes this 8% correction more significant than the February 8% correction.
As we noted above, technicians call this a “distribution pattern” and it is bearish. It often means those that bought earlier are selling at a profit to “weak-handed” traders. Such patterns often occur when a market is changing direction.
<Click on chart for larger image>
Bond Volume Confirms
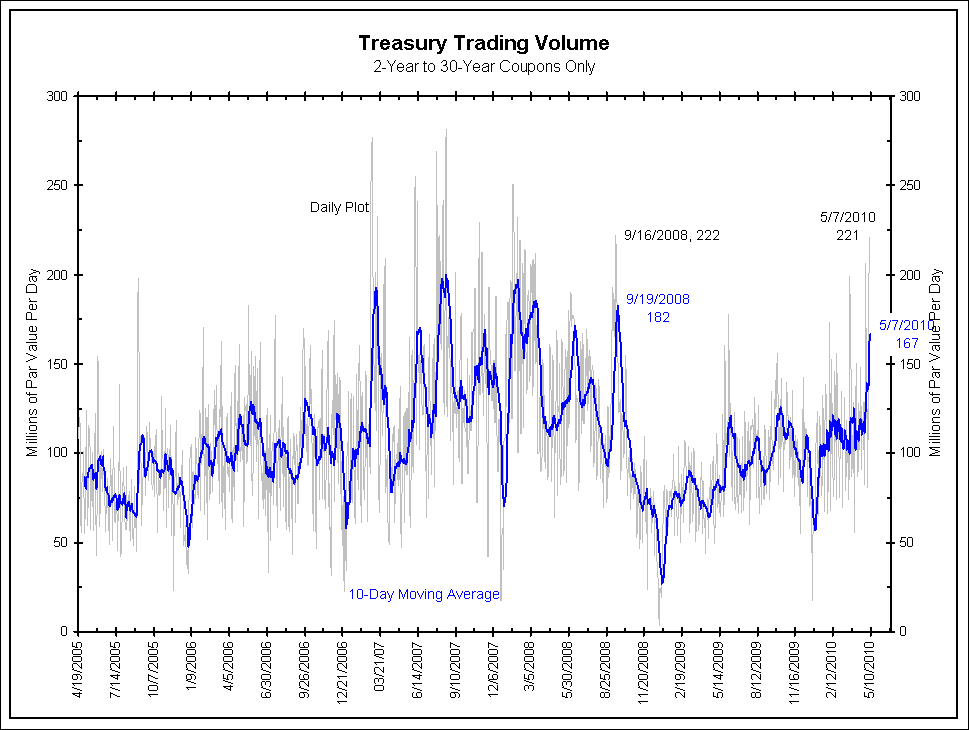
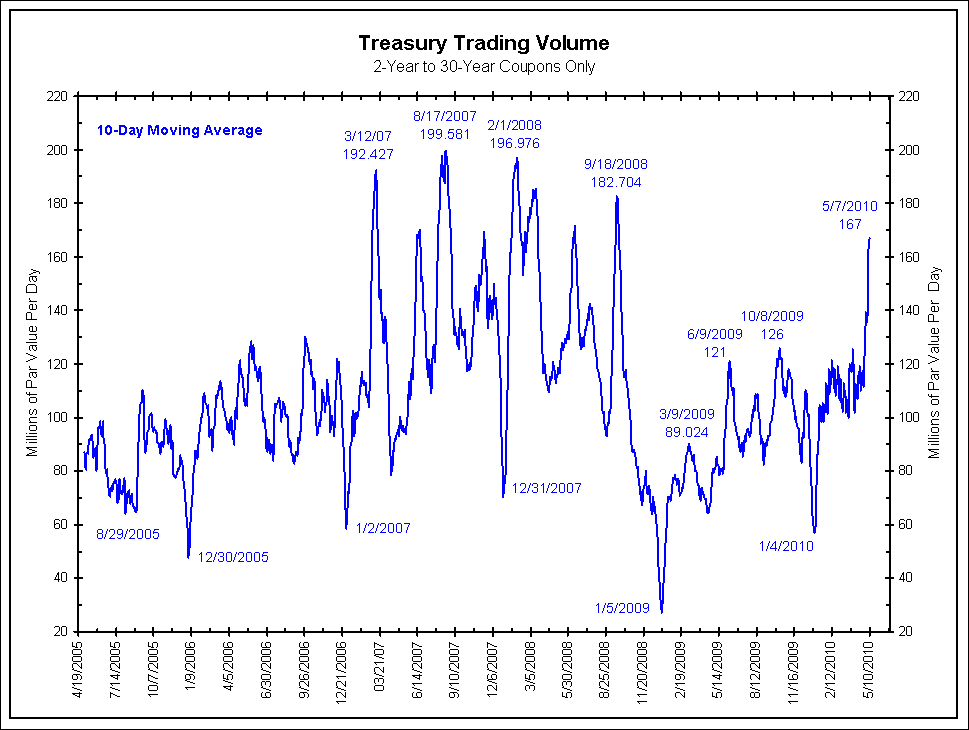
The next two charts detail Treasury market trading. They show a similar volume spike, suggesting that the spike in stock market volume is not a technical aberration within the stock market.
Technicians say that volume shows conviction. When volume spikes as markets are seeing higher volatility and changes in the existing trend, it suggests investors/traders are rethinking the sustainability of the existing trend. This is what we are seeing now. Risk assets are being questioned to a degree not seen since the March 2009 low.
<Click on chart for larger image>
<Click on chart for larger image>


What's been said:
Discussions found on the web: