There isn’t an economic release I look at that I don’t try to put in the context of jobs, because ultimately it’s jobs (preferably good ones) that are the lifeblood of any economy. So I spend a fair amount of time looking at various data points and their correlation to jobs. I want to know if there’s a relationship. If so, what is it? Does the data point lead jobs, lag jobs, run coincident to jobs? What’s the best way to look at and analyze the relationship?
In that vein, and given the relatively positive spin put on the recently released ISM Manufacturing Index, it was off to Microsoft Excel to see what nuggets I might uncover about how this index correlates to jobs.
Here’s what I found:
• ISM Manufacturing usually does not spend much time above 60. It printed at 60.4 in April and dropped slightly in May (59.7). In the previous 485 readings, it has printed above 60 48 times, or 9.9% of the time.
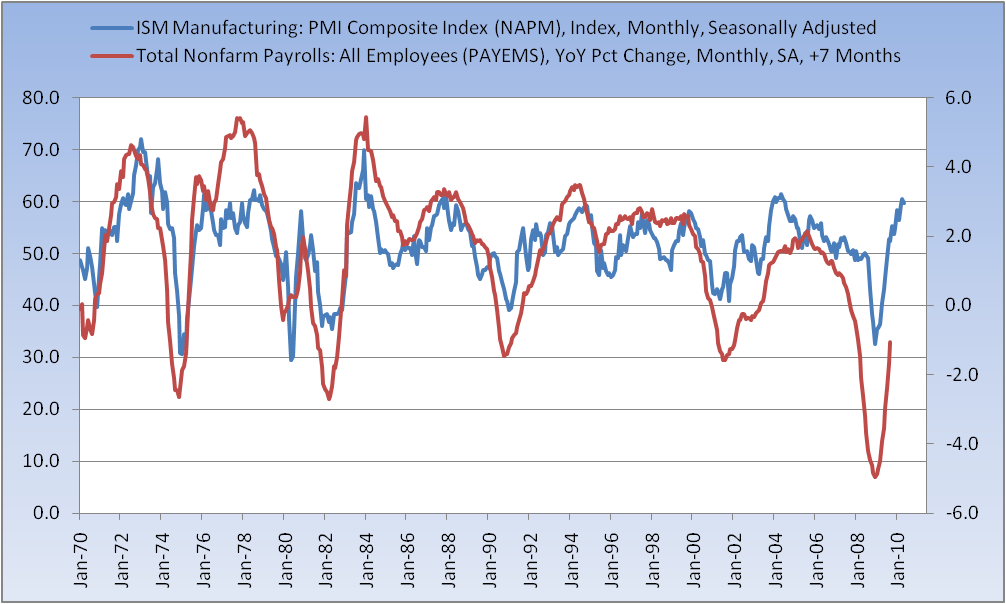
• The Year-over-Year change in Payrolls lags ISM Manufacturing by about seven months.
So, here’s a graphic representation of that relationship, with Payrolls pushed by seven months to better align the two measures and produce a correlation of 0.73.
>
>
Look at the chasm that opened up this cycle as employment fell (at its worst) by 4.9% YoY while ISM Manufacturing bottomed at 32.
Now, ISM has rebounded to ~60 while employment, though certainly up sharply YoY from the trough, still has far to go in this game of catch-up. The point is this — is this as good as it gets? I have maintained that some releases (like ISM Manufacturing, for example) seem to be flashing late-stage before employment has had any opportunity to climb out of its ditch. Should this trend continue, and I suspect it may, it does not bode well for the sustainability of this “recovery.”
We’ll see how this plays out anew with the release of the May jobs report tomorrow morning.


What's been said:
Discussions found on the web: