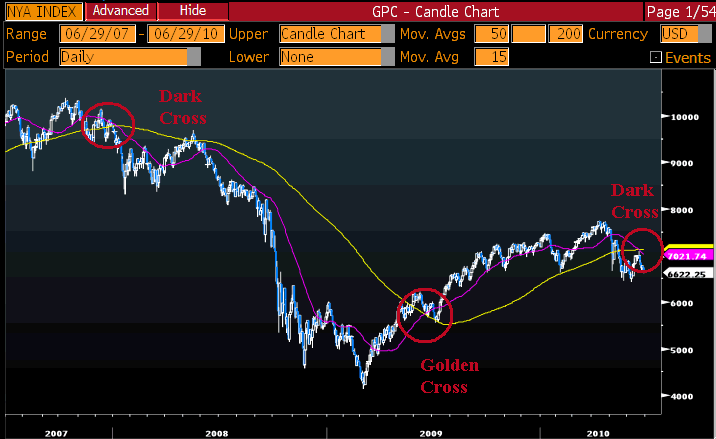
Top flight technician Mary Ann Bartels (BofA/ML) comments on the one-year anniversary of the Golden Cross, and the “Dark Cross” — its evil twin — that is now upon us:
June 23, 2010 marked the 1-year anniversary of last June’s bullish Golden Cross of the 50-day moving average above the 200-day moving average. This Golden Cross signal preceded a 12-month return of 22.4% on the S&P 500. The average 12-month return for the 42 Golden Crosses that have occurred since 1928 is 9.6%. More importantly, the June 23, 2009 signal occurred during the NBER recession that began in December 2007 and Golden Crosses associated with recessions show a much stronger average 12-month return of 19.5%. The average 12-month return for the S&P 500 over the same period is 7.2%.[…]
The bearish counterpart of the Golden Cross is called a Dark Cross. This signal occurs when the 50-day moving average crosses below the 200-day moving average. For the S&P 500, Dark Crosses are not all that bearish. The 42 Dark Cross signals that have occurred since 1928 have generated an average 12-month return of 2.4% for the S&P 500 vs. the average S&P 12-month return of 7.2%.[…]
She concludes with this rather ominous observation:
The current trading range on the S&P 500, which began in 2000, has seen two of these more bearish signals – one in 2000 and the other in 2007.
~~~
BR here — I whipped up this chart of the NYSE using the 50 and 200 day moving averages


What's been said:
Discussions found on the web: