The Case-Shiller Index printed this morning, so a bit of chart/table porn is in order.
Below is a 20-in-1 look at the Composite 20 (both the chart and the table are NSA):
19 of the 20 metro areas showed sequential gains for the month, the only laggard being Las Vegas.
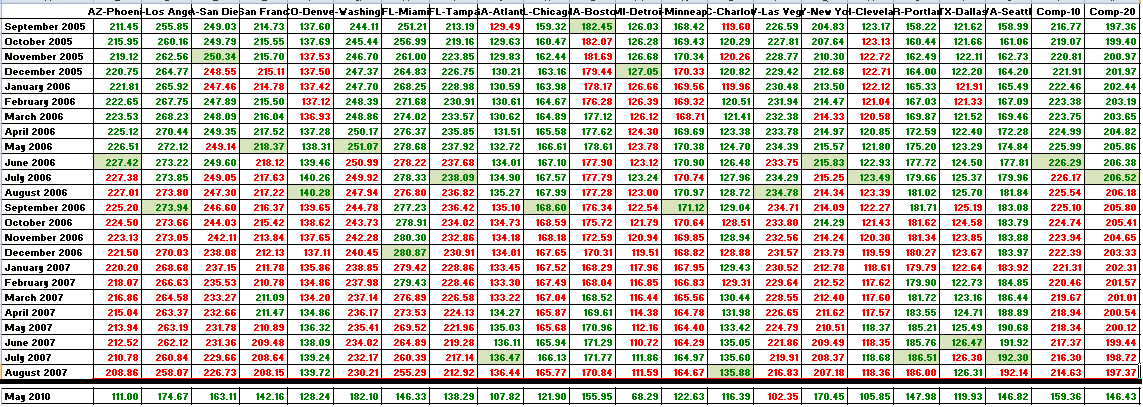
Here’s a nostalgic city-by-city look back at the two year period that defined the peak of the bubble, and where we stand now. Interestingly, Boston was the first city to peak, in September 2005. Charlotte brought up the rear, peaking two years later in August 2007.
(Please click through the image for clarity.)


What's been said:
Discussions found on the web: