I want to add to Invictus’ commentary taking Newsweek’s International editor, Fareed Zakaria, to task. There are three facts that I believe put the issue into much better context than Zakaria’s opinions do.
1) The average cash-to-assets ratio for corporations more than doubled from 1980 to 2004. The increase was from 10.5% to 24% over that 24 year period. That was the findings of a 2006 study by professors Thomas W. Bates and Kathleen M. Kahle (University of Arizona) and René M. Stulz (Ohio State). When looking for an explanation, the professors found that the biggest was an increase in risk.
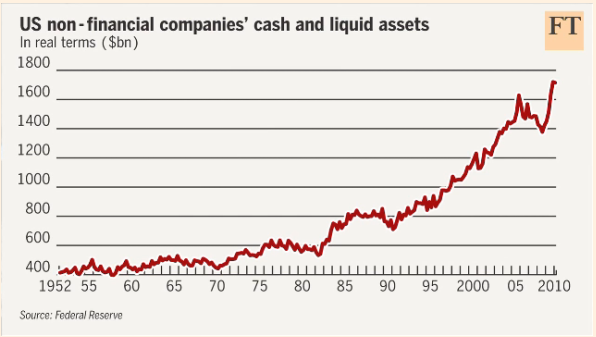
Indeed, the phenomena of corporate cash piling up has been going on for a long long time. You can date it back to the beginning of the great bull market in 1982 to 86, went sideways til the end of the 1990 recession. It has been straight up since then, peaking with the Real Estate market in 2006. The financial crisis caused a major drop in the amount of accumulated cash, but it has since resumed its upwards climb.
This FT chart makes it readily apparent that this is not a new trend:
>

chart courtesy of FT.com
>
2) The total cash numbers numbers are somewhat skewed by a handful of companies with a massive cash hoard. Exxon Mobil, GE, Microsoft, Apple, Google, Cisco, Johnson & Johnson, Verizon, Altria, EMC, Disney, Oracle, etc.
3) Not only is this not new, but the media has been covering it for years. See for example, this 2006 USA Today about the same phenomena: Many companies stashing their cash. Or this 2008 Businessweek article: Stocks: The Kings of Cash. Or this 2009 WSJ article: Corporate-Cash Umbrellas: Too Big for This Storm?.
So why all the sturm und drung? Well, it makes for a good narrative — facts be damned. Zakaria, whose international reporting is usually excellent, does not let his apparent unfamiliarity with corporate balance sheets or history prevent him from opining on the subject. Perhaps Kartik Athreya should have been more focused on the mainstream media, instead of bloggers . . .
>
Update: July 12th, 2010, 2:30PM:
Be sure to see our spreadsheet analysis of the Cash and Equivalents: Corporate Cash: Top 20 Firms = $635 Billion
>
UPDATE 2: December 22, 2010 3:49pm
Jim Bianco reports corporate cash is 7.3% — exactly what the historical median has been.
>
Sources:
Why Do U.S. Firms Hold So Much More Cash Than They Used To?
Thomas W. Bates and Kathleen M. Kahle
National Bureau of Economic Research, March 2007
(PDF here)
http://papers.ssrn.com/sol3/papers.cfm?abstract_id=927962
Many companies stashing their cash
Matt Krantz
USA TODAY 6/1/2006
http://www.usatoday.com/money/companies/management/2006-06-01-cash-is-king-usat_x.htm
Stocks: The Kings of Cash
Beth Piskora
Businessweek, April 18, 2008
http://www.businessweek.com/investor/content/apr2008/pi20080417_375812.htm
Corporate-Cash Umbrellas: Too Big for This Storm?
JASON ZWEIG
WSJ MARCH 14, 2009
http://online.wsj.com/article/SB123698238718924581.html


What's been said:
Discussions found on the web: