I have been meaning to point to the NY Fed’s report on Household Debt. It is laden with all manner of good stuff. I thought this paragraph was significant:
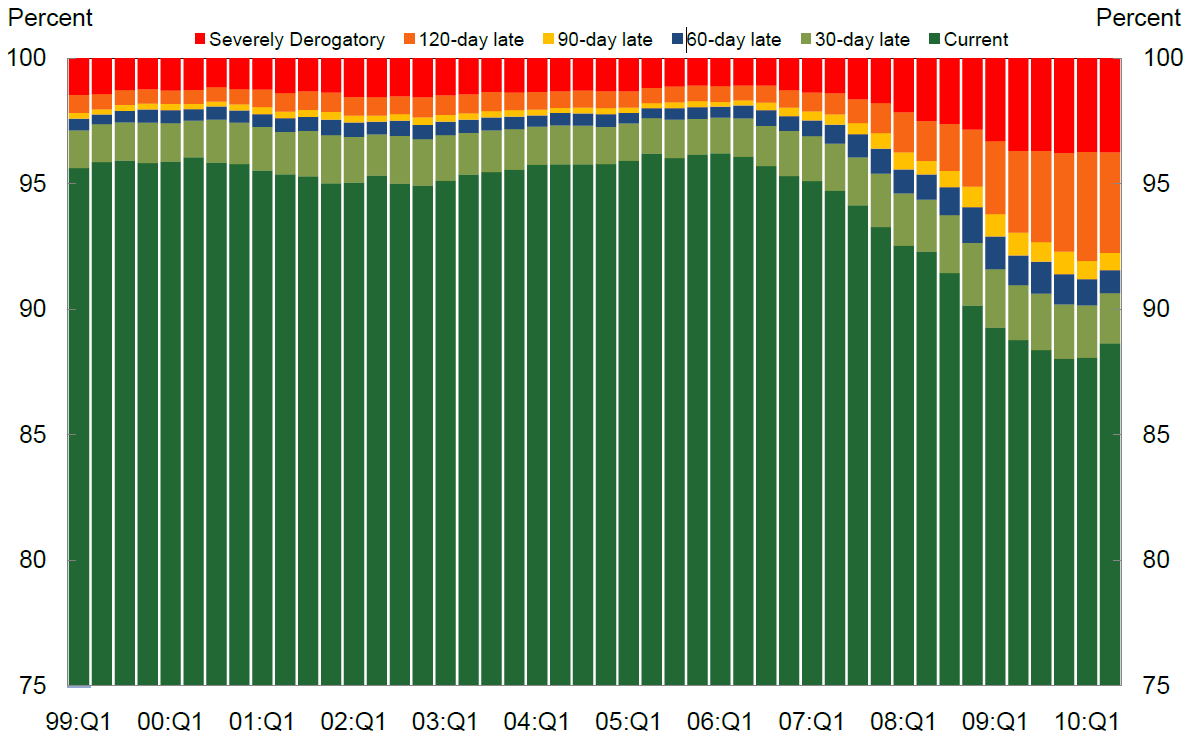
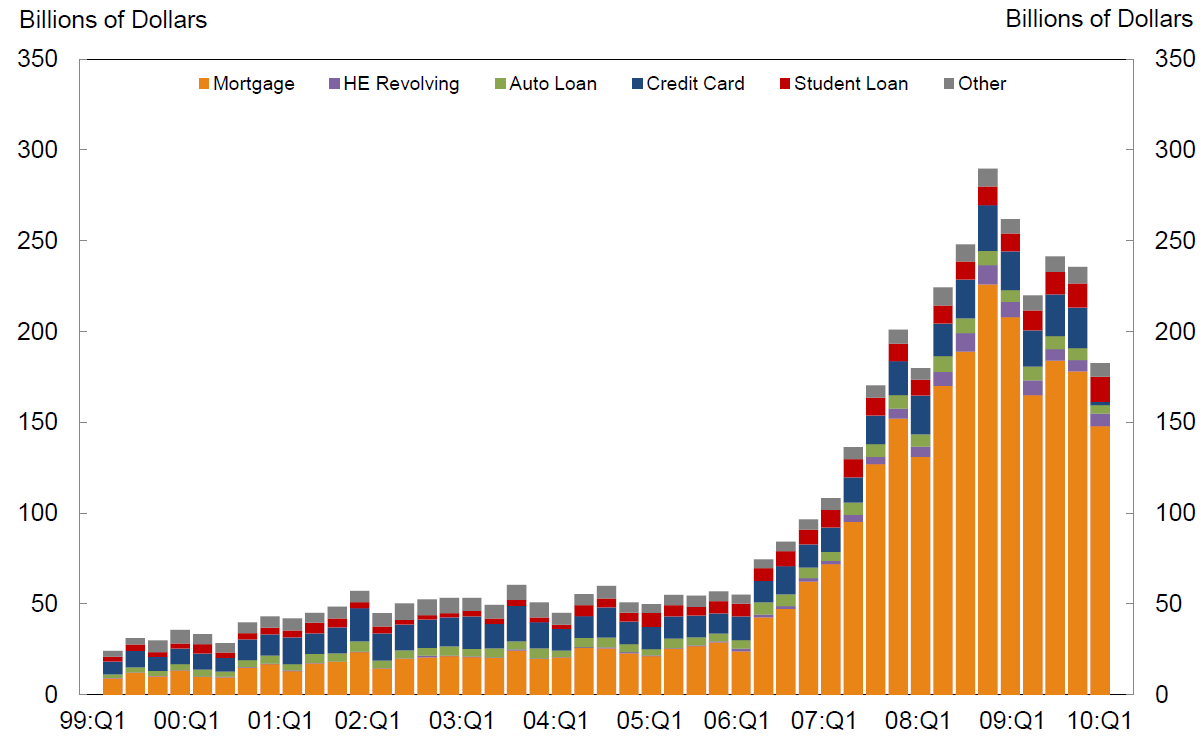
For the first time since early 2006, total household delinquency rates declined in 2010Q2. As of June 30, 11.4% of outstanding debt was in some stage of delinquency, compared to 11.9% on March 31, and 11.2% a year ago. Currently about $1.3 trillion of consumer debt is delinquent and $986 billion is seriously delinquent (at least 90 days late or “severely derogatory”). Delinquent balances are now down 2.9% from a year ago, but serious delinquencies are up 3.1%.
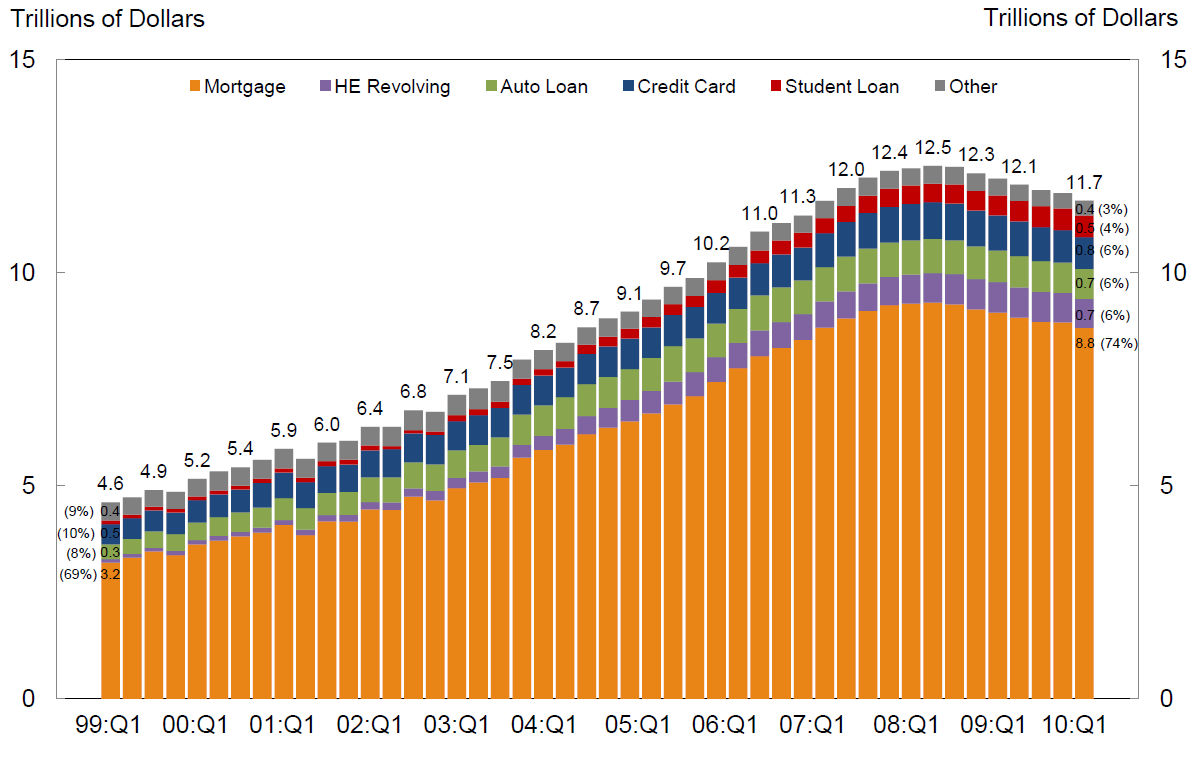
I of course was enamored of the chart porn:
>
Total Debt Balance and its Composition
Total Balance by Delinquency Status
New Seriously Delinquent Balances by Loan Type
>
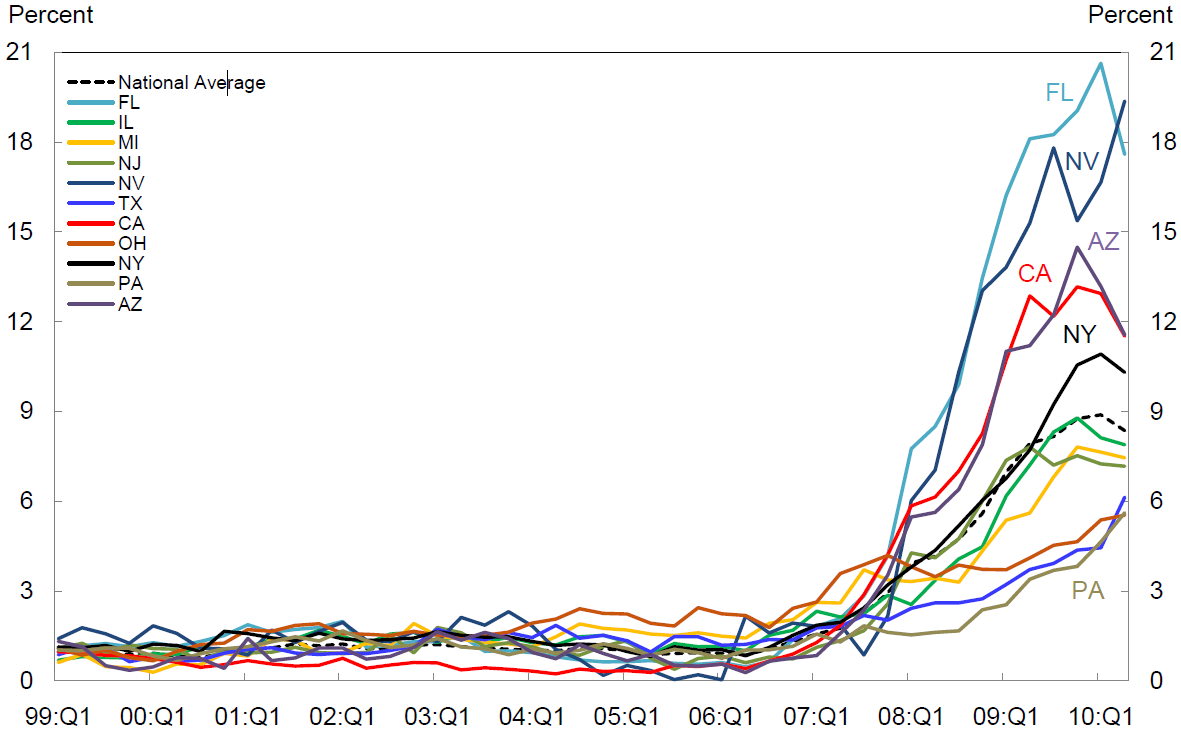
This one is probably the most informative of all:
Percent of Mortgage Debt 90+ Days Late by State
All charts sourced FRBNY Consumer Credit Panel
>
Source:
QUARTERLY REPORT ON HOUSEHOLD DEBT AND CREDIT
FEDERAL RESERVE BANK OF NEW YORK
RESEARCH AND STATISTICS ● MICROECONOMIC AND REGIONAL STUDIES
August 2010
http://www.newyorkfed.org/research/national_economy/householdcredit/DistrictReport_Q22010.pdf


What's been said:
Discussions found on the web: