There was a ton of data released last week, some of which we only get quarterly or annually. It would be virtually impossible to comment on all the items of interest contained in just three of the more bountiful reports — the Census Bureau’s annual release of Income, Poverty and Health Insurance in the United States, the quarterly Fed Flow of Funds report (one of my favorites, even though the data’s always a bit stale), and the monthly Small Business Economic Trends report from the National Federation of Independent Business. That said, here are a few items that caught my eye which tend to be overlooked and not reported elsewhere.
HOUSEHOLD FORMATION
Among the things that jumped out at me in last week’s Income, Poverty and Health Insurance in the United States: 2009, which is always a fascinating read, was the virtually stagnant condition of household formation in the United States. Page 13 of the report shows the number of households in the U.S. in 2008 as 117,181,000. For 2009, Census tells us the number rose to 117,538,000, for a gain of 0.30%, the lowest growth rate on record according to their database (and eclipsing what had been the previous lowest on record — 0.34% — in 2008).
Here’s a graphic (calculated using Table HH-1):
>
>
The formation of new households is obviously critical for the growth of the economy for more reasons than I could detail here (think housing, for starters, then move on to durable goods, then perhaps autos). While one would expect the rate to decline in hard times (job insecurity, wage stagnation), a continuation of this trend will only serve to exacerbate some of the challenges we’re trying to work through.
[ADDING 9/20/2010: We have heard from Calculated Risk regarding the usability/utility of the chart above and the underlying data from which I derived it (i.e. it tends to be unreliable as a time series). In fact, CR had a post here just Saturday on this very topic; readers are encouraged to have a look. That said, we do clearly agree that “combined data suggest extremely slow growth over the last few years,” and that is my overarching point.]
HOUSEHOLD OWNERSHIP OF TREASURIES
Turning to Friday’s Fed Flow of Funds report, I noted that Treasury securities on the balance sheet of U.S. households have exploded — by $616 billion from the second quarter of 2009 to the second quarter of 2010. From $447.448B to 1.063622T:
>
>
Now, this is not to say I am in the bond bubble camp, as I am not. I am merely pointing out that the flight to safety is — and will likely continue to be — in full effect as economic uncertainty prevails and boomers (and retirees) struggle to get what safe income they can. I would also note that part of this equation probably has to do with the fact that — at ~2.75% on the 10-year — it takes a lot more bonds money to produce the same income than it would at, say, 5% or higher. None of this is to say that Treasuries represent a significant percent of household assets — they do not. But the almost vertical rise in dollar terms is noteworthy.
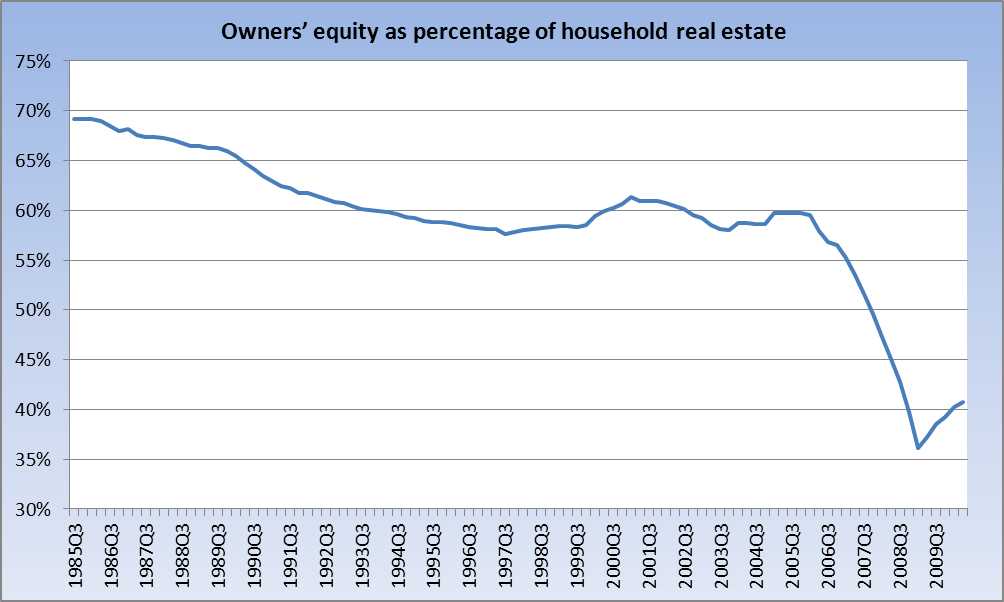
As Americans continue the long, hard slog of balance sheet repair, it is encouraging to see owners’ equity as a percent of real estate on the mend, though there’s a long way to go:
>
>
NATIONAL FEDERATION OF INDEPENDENT BUSINESS – SMALL BUSINESS ECONOMIC TRENDS
The NFIB put out its Small Business Economic Trends report last week, and although the Optimism Index eked out a modest gain (though still mired in recessionary terrain), much of the commentary was downright depressing:
There is no life in the jobs market.
The environment for capital spending is not good.
The weak economy continued to put downward pressure on prices.
Those looking for loans predominately are looking for cash flow support, not funds to expand or hire (see Small Business Credit in a Recession, 12/09).
Overall, 91 percent of the owners reported all their credit needs met or they did not want to borrow, unchanged from July.
The first two comments are fairly obvious to anyone with a pulse living in the United States. The third comment — supported by two inflation-related releases last week — argues that a deflationary scenario is not out of the question. The fourth comment is very troubling, in my opinion. It is disheartening to see that those businesses seeking credit are doing so to support their cash flow needs. Over time, without a more sustained recovery, that will not end well. While it is encouraging to see that 91% of small businesses either do not want to borrow or are having their borrowing needs met, it does call into question the talking point that “banks aren’t lending” or “credit is not available.” Finally, I would note that Poor Sales continue to be the Number One problem cited by small business — above Taxes, Gov’t Regulation/Red Tape, or any other issue: “What businesses need are customers, giving them a reason to hire and make capital expenditures and borrow to support those activities.” So for all the rhetoric about “uncertainty,” the simple fact of the matter is a lack of demand.
AND A WORD ON INFLATION after the jump
Barry’s Outcome vs Process post gives us a perfect segue to examine exactly the point he was making:
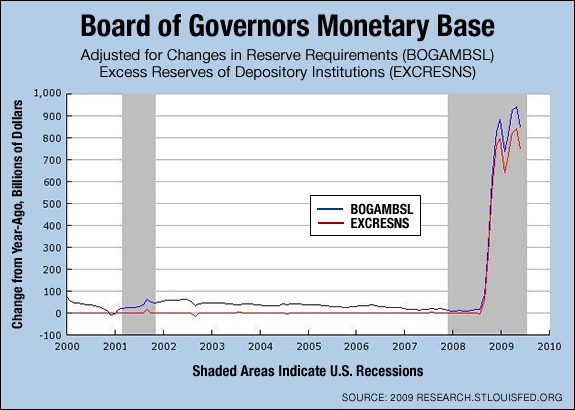
Last summer, when the Fed was well into its ZIRP, the inflationistas came out of the woodwork, offering up dire warnings about the hyperinflation to come when the floodgates of newly printed money opened and it started working its way through the system (as if). Among them was the oft-wrong, never in doubt Jerry Bowyer (who seems to have fallen off the radar in the past many months). Mr. Bowyer, a man who defines exactly the type of montebank to whom BR refers, wrote a piece over at NRO with a scary chart and equally scary forecast:
An extra $1 trillion has been created out of thin air. Nothing like this has ever happened in American history — not during WWII, not in the 1970s, and not in the aftermath of 9/11. […] But what happens when the floodgates open? At some point the banks will have to release a river of liquidity. Consumers are demanding it, Congress is demanding it, and even President Obama is demanding it. (That last one may well be the clincher.)
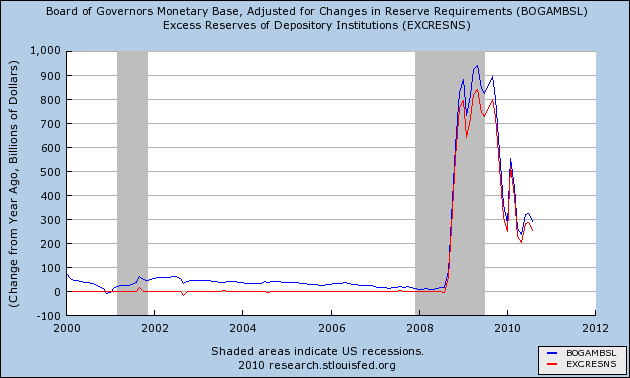
I’ve taken the liberty of updating Jerry’s chart (which itself was a take off on some work Arthur Laffer had done):
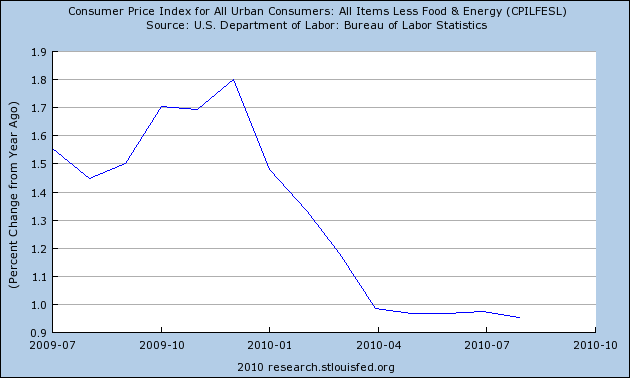
And, for good measure, let’s have a quick look at core CPI since Jerry’s post:
Importantly, inflation expectations declined in last Friday’s U of M Consumer Sentiment release, which could become a self-fulfilling prophecy.
I wrote here, in July 2009, about Mssrs. Laffer and Bowyer: “There’s no demand for the money that’s “sloshing around the system,” and there likely isn’t going to be for some time to come – and by that I mean years, not months or quarters.” And, in fact, there has not been. Consider that housing affordability is at near record levels while mortgage rates are near record lows, yet the housing market remains moribund — how can that be with so much liquidity “sloshing around the system”?
At this point, deflation remains the more worrisome outcome.


What's been said:
Discussions found on the web: