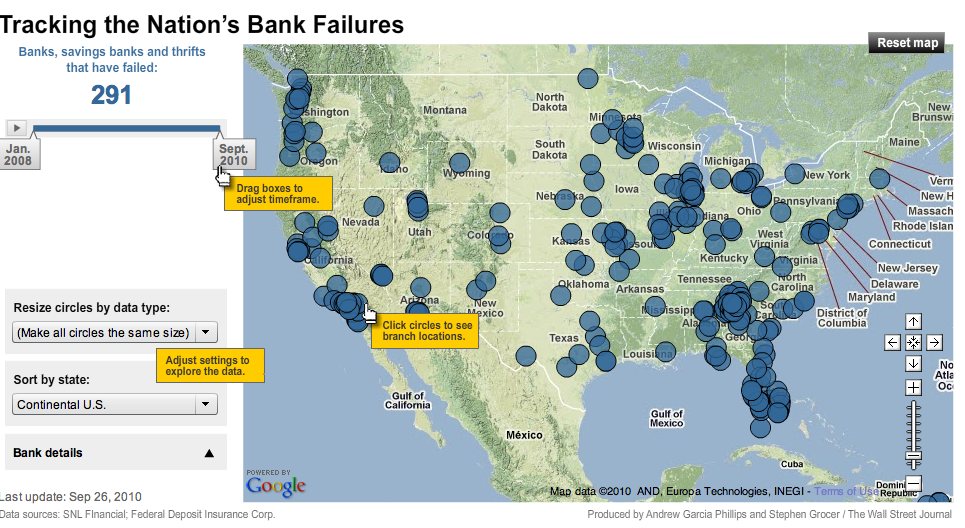
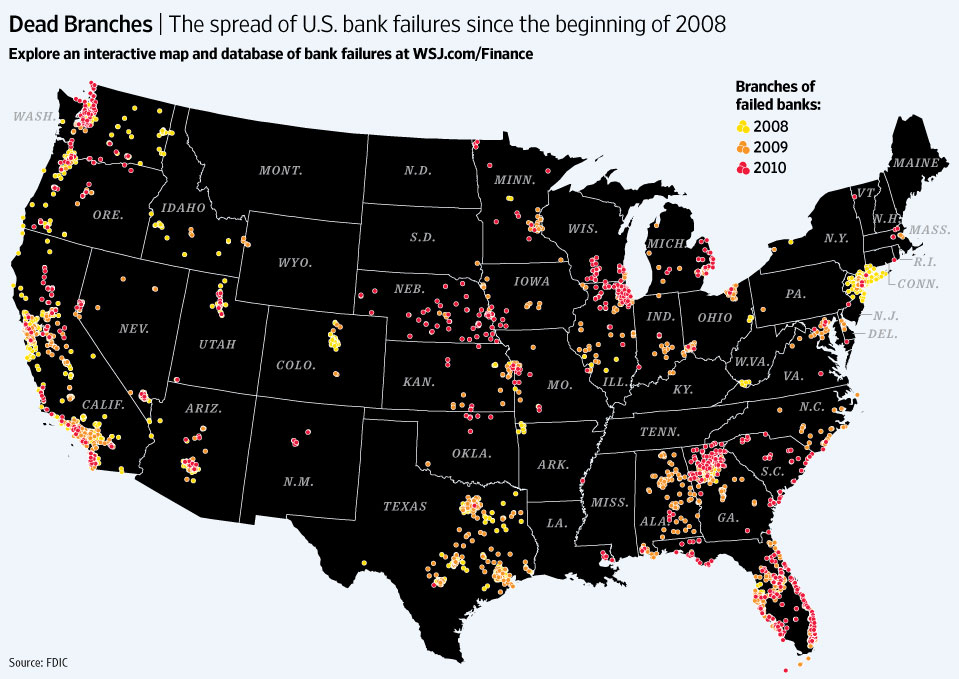
As a follow up to our weekly FDIC bank closing charts, the WSJ has an article with accompanying interactive graphic (below) showing the progress of bank closings over the past 2 years.
They note that since WaMu fell, 279 lenders have collapsed; where the closings are concentrated was somewhat unexpected:
>
click for interactive graphic

courtesy of WSJ
>
This is a static version that also shows the distribution of failures:
click for larger map

>
Source:
Banks Keep Failing, No End in Sight
RANDALL SMITH And ROBIN SIDEL
WSJ, SEPTEMBER 27, 2010
http://online.wsj.com/article/SB10001424052748704760704575516272337762044.html


What's been said:
Discussions found on the web: