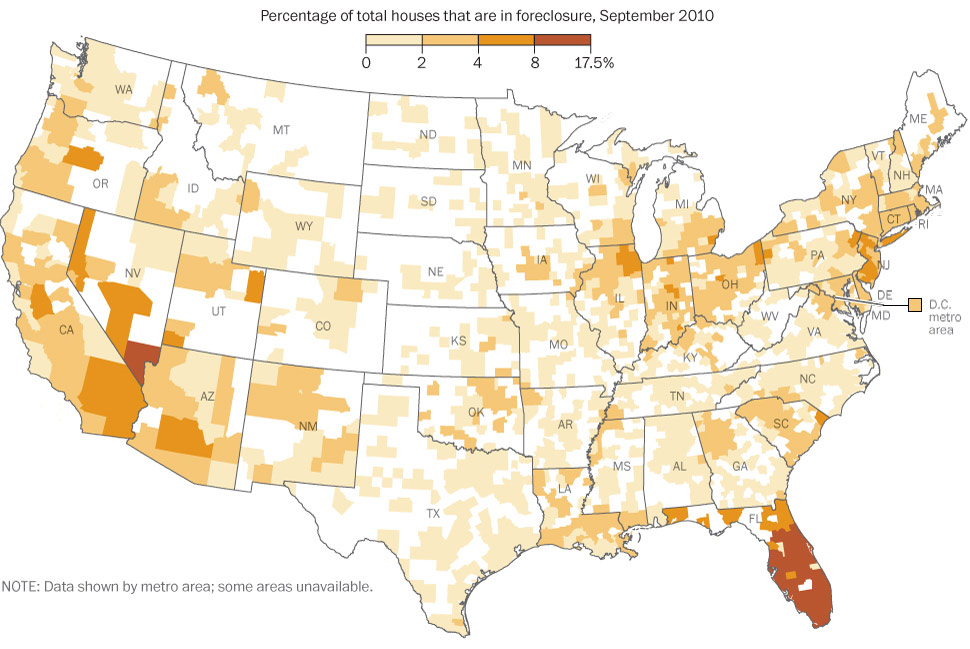
Here is a fascinating graphic from the Washington Post about where in the US, by County, foreclosures have taken place, color coded by percentage.
It is rather remarkable:
>
click for larger graphic

Map courtesy of the Washington Post
Foreclosure data from CoreLogic | Cristina Rivero and Mary Kate Cannistra/The Washington Post
~~~
And with this post, we add the category Foreclosures, rather than select Credit/Legal/Real Estate each time . . .


What's been said:
Discussions found on the web: