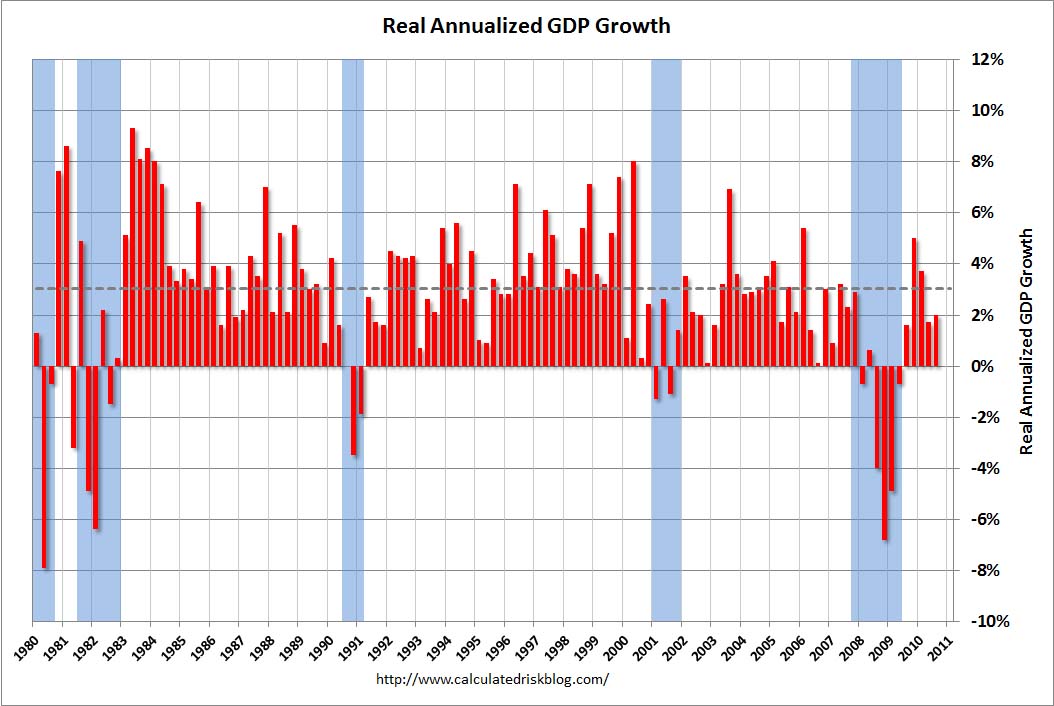
I just got back to the office, and wanted to take a quick look at GDP data, which seems to be dominated by inventory build:
“Real gross domestic product — the output of goods and services produced by labor and property located in the United States — increased at an annual rate of 2.0 percent in the third quarter of 2010, (that is, from the second quarter to the third quarter), according to the “advance” estimate released by the Bureau of Economic Analysis. In the second quarter, real GDP increased 1.7 percent.
The increase in real GDP in the third quarter primarily reflected positive contributions from personal consumption expenditures (PCE), private inventory investment, nonresidential fixed investment, federal government spending, and exports that were partly offset by a negative contribution from residential fixed investment. Imports, which are a subtraction in the calculation of GDP, increased.
The small acceleration in real GDP in the third quarter primarily reflected a sharp deceleration in
imports and accelerations in private inventory investment and in PCE that were partly offset by a
downturn in residential fixed investment and decelerations in nonresidential fixed investment and in exports.
Here are the breakdowns:
• The change in real private inventories added 1.44% percentage points to the third-quarter change in real GDP after adding 0.82% percentage point to the second-quarter change.
• Private businesses increased inventories $115.5 billion in the third quarter, following increases of $68.8 billion in the second quarter and $44.1 billion in the first.
• Real final sales of domestic product — GDP less change in private inventories — increased 0.6% in Q3 compared with an increase of 0.9 % in Q2.
• Motor vehicle output added 0.42% to Q3 (after subtracting 0.06% in Q2);
• The price index for gross domestic purchases (prices paid by U.S. residents) increased 0.8% in Q3;
• Excluding food and energy prices, the price index for gross domestic purchases increased 0.6% Q3, compared with an +0.8% in Q2;
• Real personal consumption expenditures increased 2.6% versus 2.2% in Q2;
•Durable goods increased 6.1% vs 6.8% Q2.
•Nondurable goods increased 1.3% vs 1.9%; Services gained 2.5% vs 1.6%
• Real nonresidential fixed investment increased 9.7%vs 17.2%
• Nonresidential structures increased 3.9% percent vs 0.5%
• Equipment and software increased 12% vs 24.8% in Q2
• Real residential fixed investment decreased 29.1% (vs an increase of 25.7% in Q2).
• Real exports of goods and services increased 5.0% Q3 (vs 9.1%)
• Real imports of goods and services increased 17.4 percent,
compared with an increase of 33.5 percent.
• Real federal government consumption expenditures and gross investment increased 8.8% Q3 vs 9.1%; National defense increased 8.5% vs +7.4%; Nondefense increased 9.6% vs 12.8%
>
Annualized GDP

Chart via Calculated Risk
>
Source:
National Income and Product Accounts
Gross Domestic Product, 3rd quarter 2010 (advance estimate)
BEA, 8:30 A.M. EDT, FRIDAY, OCTOBER 29, 2010
http://www.bea.gov/newsreleases/national/gdp/gdpnewsrelease.htm


What's been said:
Discussions found on the web: