Today’s insane data point: Since Ben Bernananke floated his QE2 trial balloon in August, the Wilshire 5000 has gained ~10% — or $1.3 trillion in value. Not a bad bump in capitalization.
That observation comes to us via Randall Forsyth in this week’s Barron’s:
“SINCE BERNANKE STARTED laying out the rationale for further easing in his speech at the Fed’s annual bash in Jackson Hole, Wyo., in late August, the U.S. Dollar Index has declined roughly 7% against that basket. Over the past six weeks, gold is up more than $100 an ounce, topping $1360 as the Fed and other central banks engage in their race to debasement.
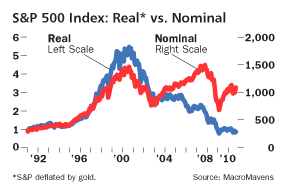
During that same span, the Wilshire 5000 has gained about $1.3 trillion in value, or about 9.9%. But the rise in stocks may be more apparent than real. The rise in equity prices is in terms of dollars that are rapidly losing value. Relative to gold—which central banks can’t expand ad infinitum at zero cost—stocks haven’t done much. Indeed, relative to the yellow metal, stocks have had more than a lost decade, as the chart here shows.
Thus, it appears that the Fed’s efforts to expand liquidity have been far more successful in producing asset inflation than jobs, as the latest employment report, out Friday morning, reminds us. Non-farm payrolls fell by 95,000 in September instead of coming in flat or just slightly negative, as the consensus forecast called for. The glass-half-full contingent trumpeted a 64,000 gain in private payrolls, while downplaying the 82,000 plunge among state and local governments, collectively the nation’s single biggest employers.
The official unemployment rate held steady at 9.6%, but the so-called underemployment rate, which includes labor-force dropouts and part-timers who would rather have a full-time job, surged to 17.1% from 16.7%. John Williams of Shadow Government Statistics—whose call for a negative payrolls number cited here was right on the money—further adjusts the underemployment rate to count folks who have been out of the labor force a year, who don’t get counted among “discouraged workers” by the government. By his tally, true underemployment hit 22.5% in September, up from 22% in August, and a new high for the cycle but not one to crow over.”
I have been using U6 data for about 5 years, and I find it more telling than U3, which understates the labor market woes. (I worry that John William’s numbers may somewhat overstate the data).
 But its been very clear that Labor is not participating in the rally, while Capital is. Yes, if we are discussing Equity, that is in nominal terms. In fact, as the chart at right shows, relative to gold, equities have shown a steady drop in prices.
Of course, to those of us who toil in the nominal price world (i.e, domestic asset managers), that matters not a whit. (Vacation overseas and you might change your mind, but I refer to the professional obligations of asset managers).
And, as we are fond of pointing out, participating in one asset class does not prevent you from owning the other.
The choice you must make is one of residency: Where do you have to live, the real or nominal world?
>
Previously:
Unemployment Reporting: A Modest Proposal (U3 + U6) (June 12th, 2008)
Gold Hits Our $1350 Target; Now What? (October 7th, 2010)
Do You Wanna Be Right, or Do You Wanna Make Money? (October 6th, 2010)
Source:
Debasement Blues
RANDALL W. FORSYTH
Barron’s OCTOBER 9, 2010
http://online.barrons.com/article/SB50001424052970203989704575532303860728596.html


What's been said:
Discussions found on the web: