Oooh, this failed to launch (now I am having differently trouble, apparently, getting it posts up)
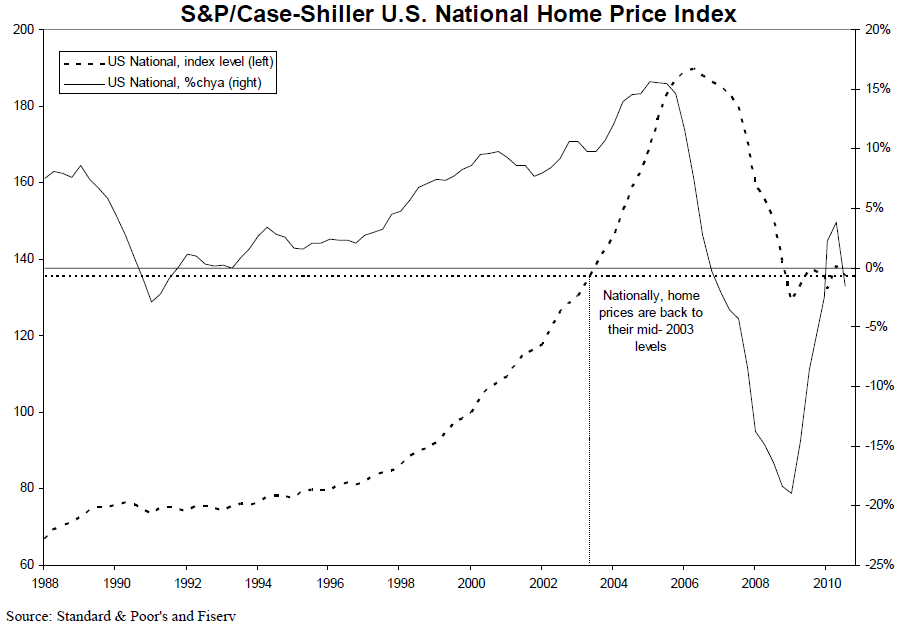
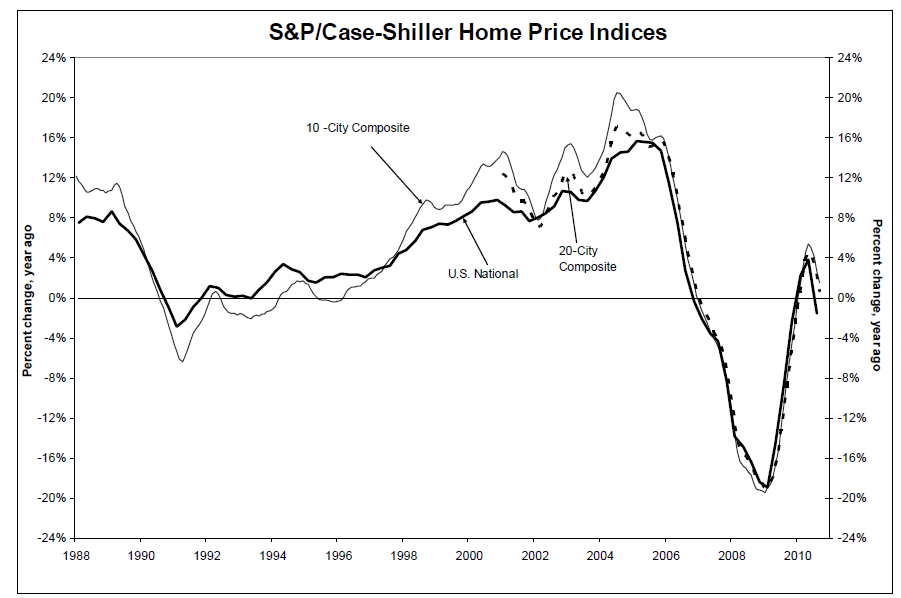
Case-Shiller1 Home Price Indices continue to decline, falling 2.0% in Q3. (Q2 saw a tax rebate driven rise of 4.7%).
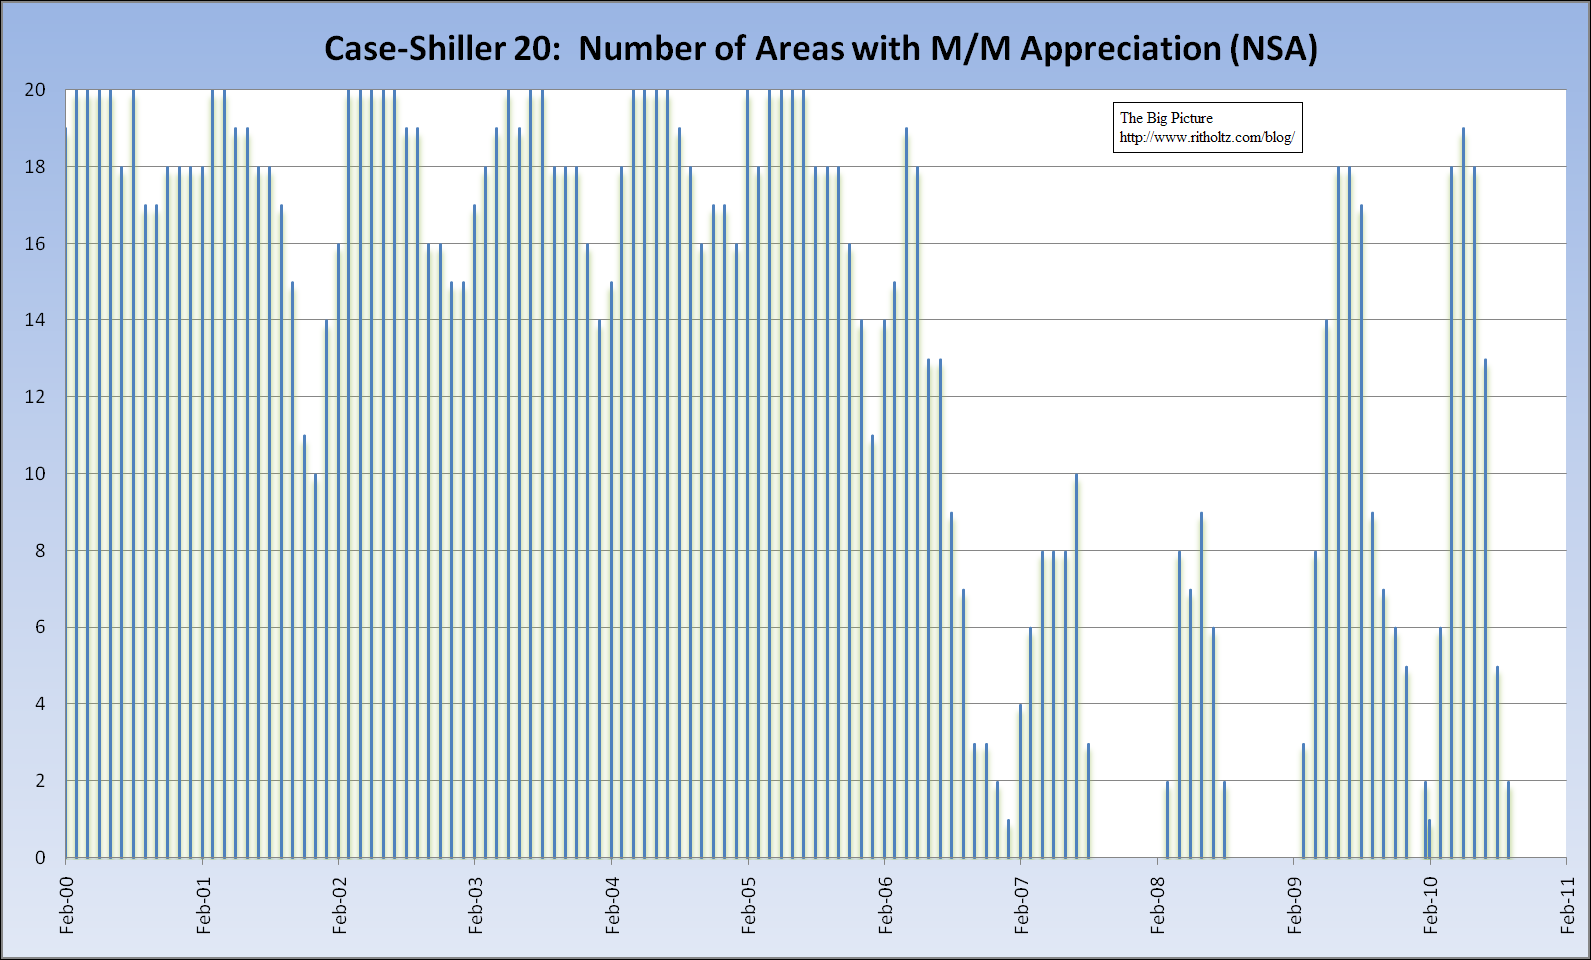
For data through September 2010, home prices are 1.5% below their year-earlier levels nationally. In September, 18 of the 20 MSAs covered by S&P/Case-Shiller Home Price Indices and both monthly composites were down; and only the two composites and five MSAs showed year-over-year gains. While housing prices are still above their spring 2009 lows, the end of the tax incentives and still active foreclosures appear to be weighing down the market. Of course, none of this comes as a surprise to anyone.
As the chart below shows, home prices have fallen back to 2003 levels:
>
click for larger charts
>
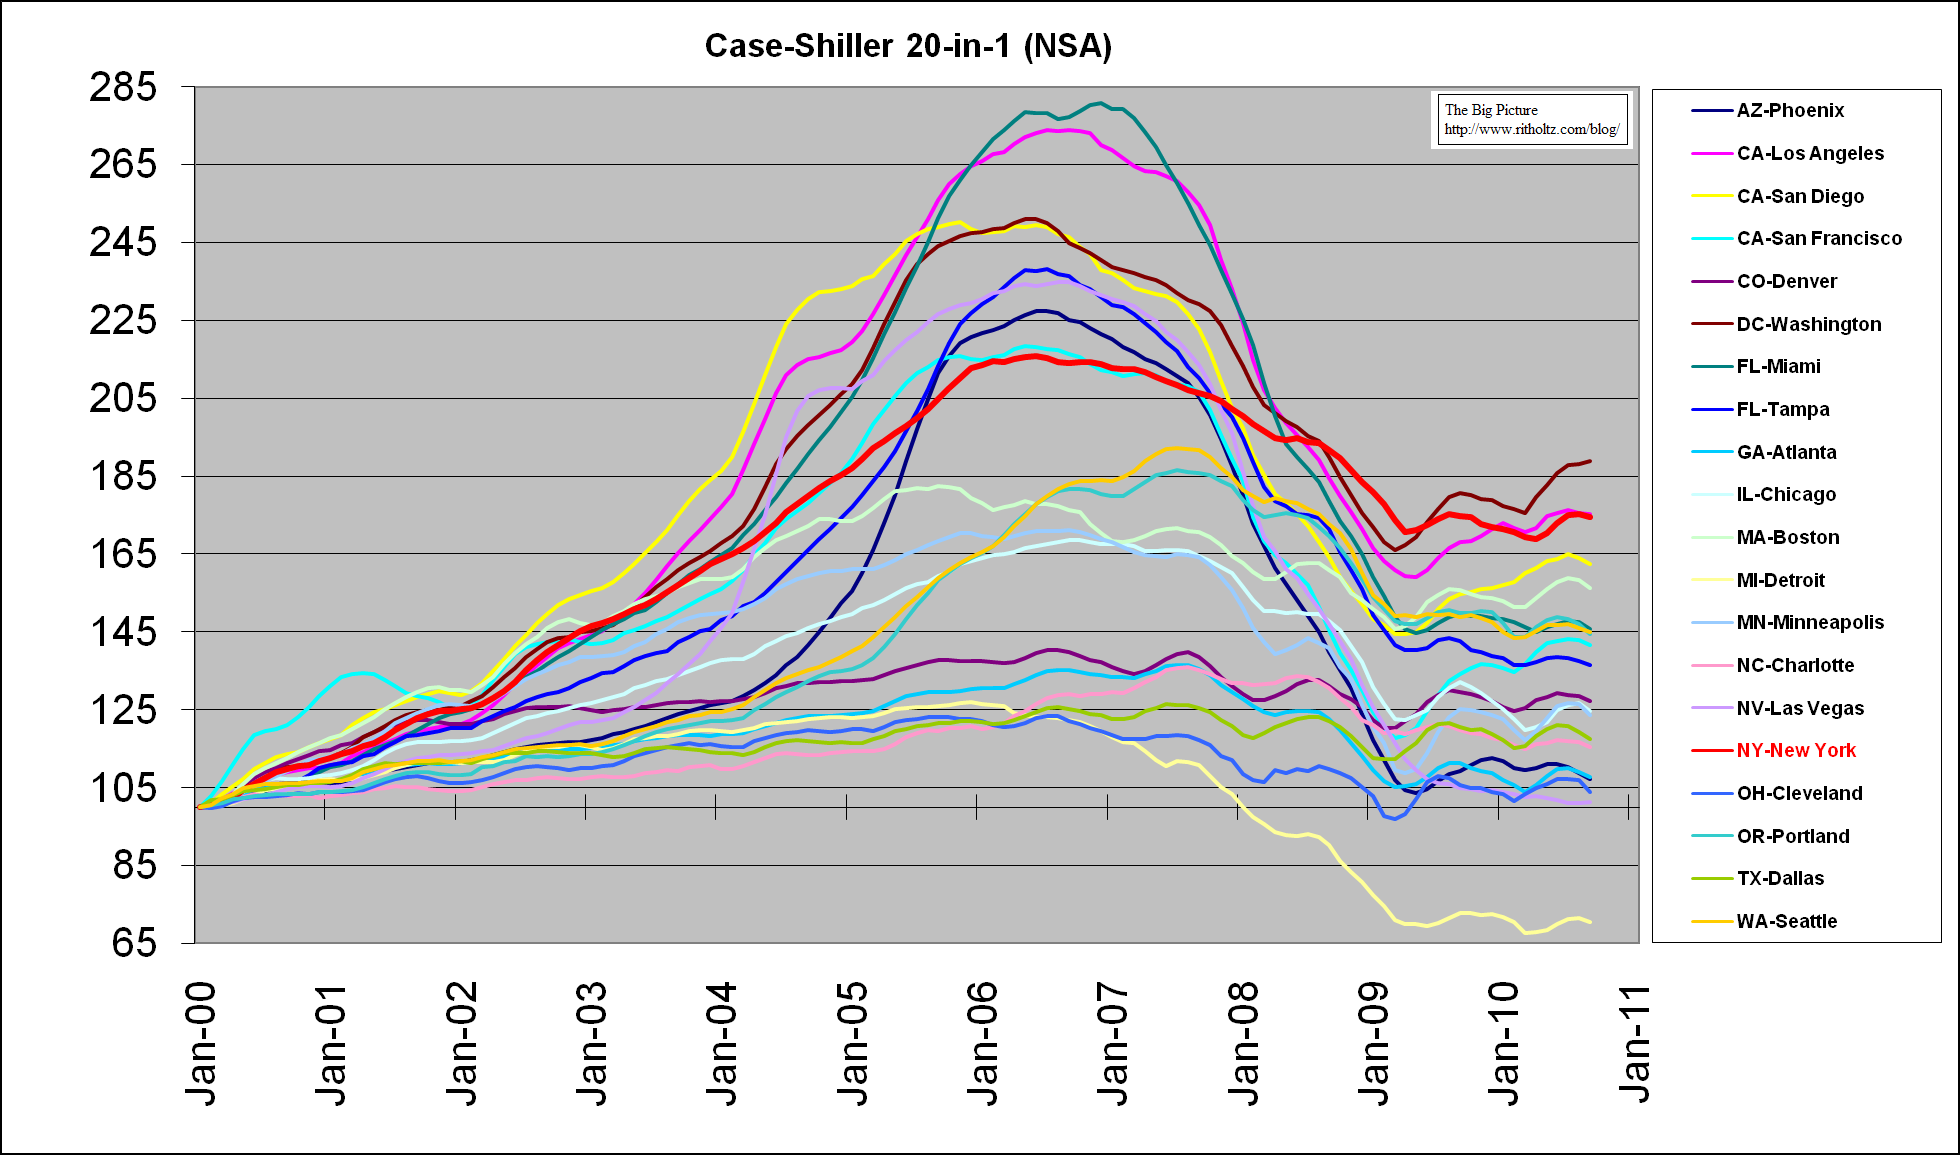
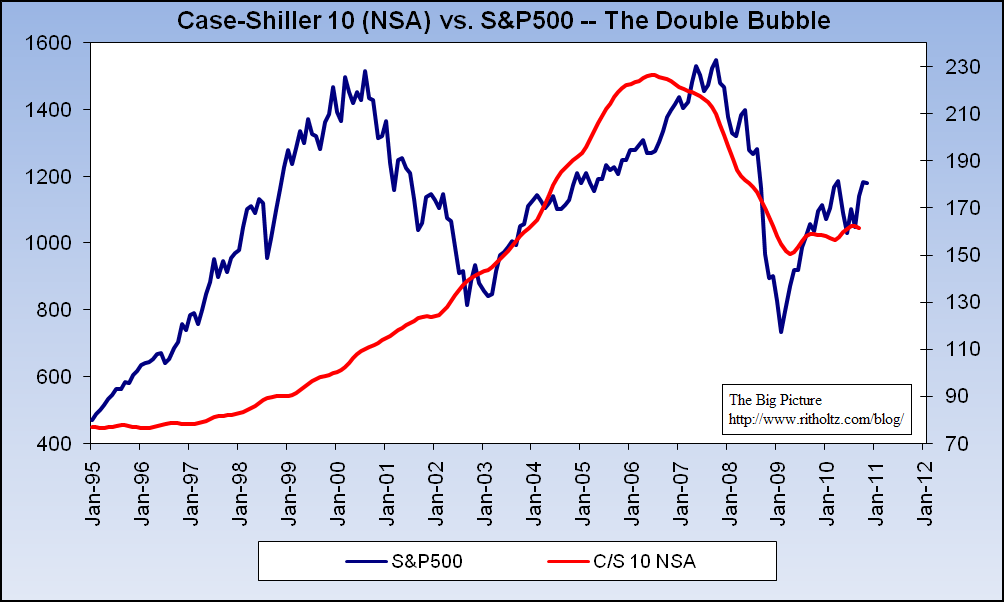
Additional charts after the jump
>
>
>
Source:
Broad-based Declines in Home Prices in the 3rd Quarter of 2010
30-Nov-2010 09:00
http://bit.ly/h0Cbs5


What's been said:
Discussions found on the web: