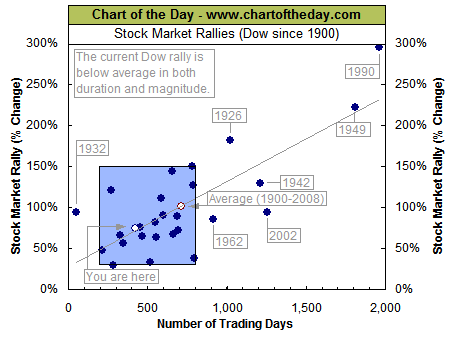
Chart of the Day has an interesting view on the state of the current cyclical bull run.
They note that “most major rallies (73%) resulted in a gain of between 30% and 150% and lasted between 200 and 800 trading days.”
I would like to see that data sliced even finer. Rather than looking at the universe of all bull markets, I would want to break it down further into rallies during secular bull and bear markets. I suspect both the duration and magnitude might be different that way.
>


What's been said:
Discussions found on the web: