2003-05 vs 2009-10
click for bigger graphs

chart via Bloomberg
>
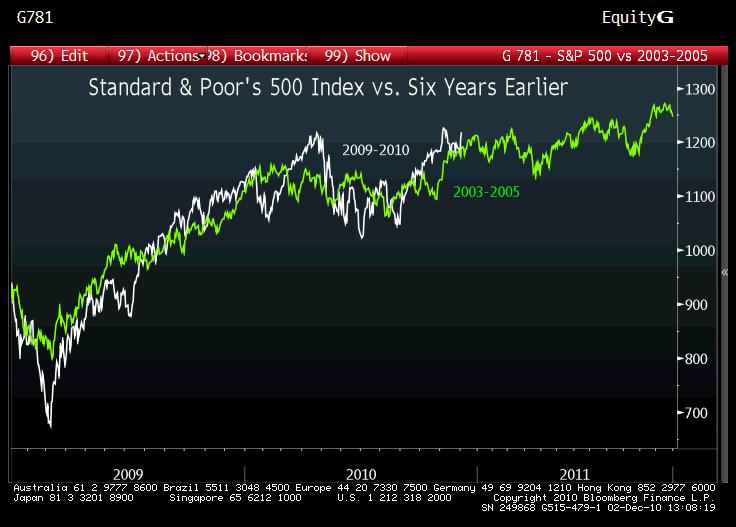
Bloomberg’s chart of the day discusses the 2003 low/rally with a few strategists comparing the run with the 2009 bottom/rally. The focus for the conversations was whether 2005 made for a good comparison with 2011.
Similarities include an erratic advance in 2003-04 that are somewhat parallel with 2009-10, as well as unusual market leadership.
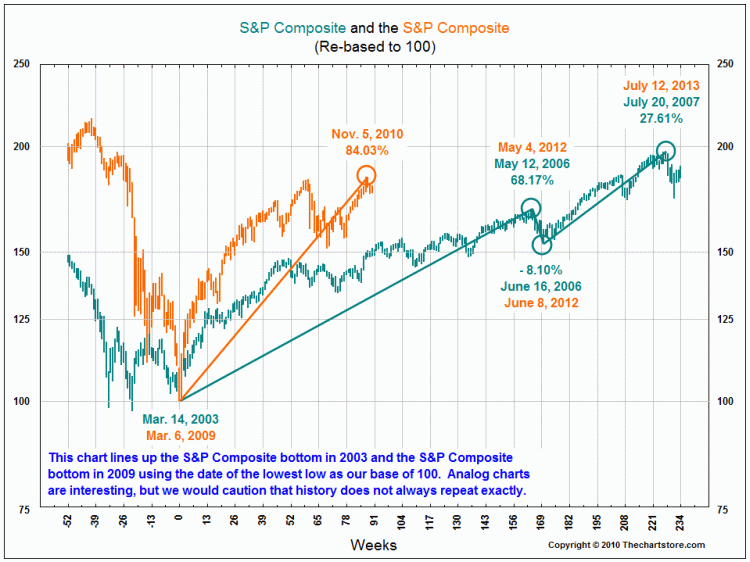
Where I find major differences is the speed and depth of the drop. In 2008-09, it was across the board, while in 2000-03 was longer and more heavily Nasdaq focused. The context of coming before and after a major global financial crisis is a major differentiator. The snapback has been much sharper as well:
>
>
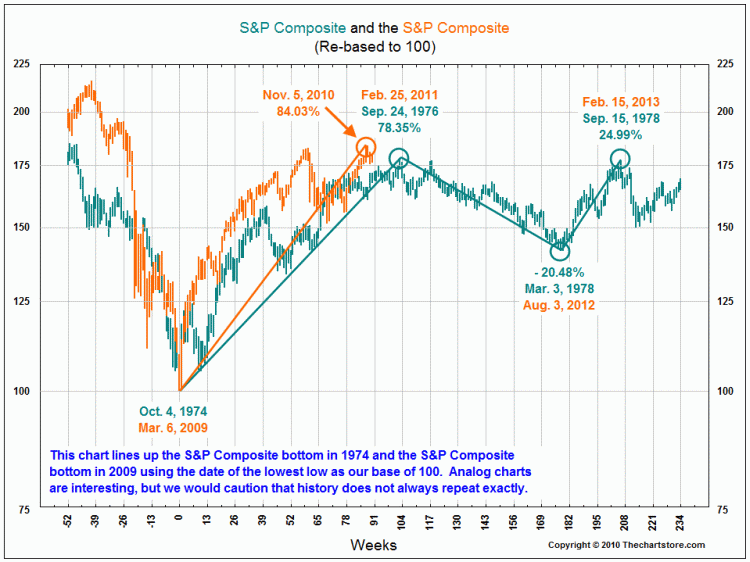
My preferred analogy this entire run has been 1973-74 markets. It is far more analogous:
>
1974 versus 2009 Bottoms

graph via The Chart Store


What's been said:
Discussions found on the web: