The Fed released its quarterly Flow of Funds (Z.1) report Thursday. Although the data is always somewhat stale (Q3 was released today), I find the Flow of Funds an interesting and informative read (how sad is that? Note to self: Get a life.). That said, here are some nuggets I think are of interest (all data from Table B.100):
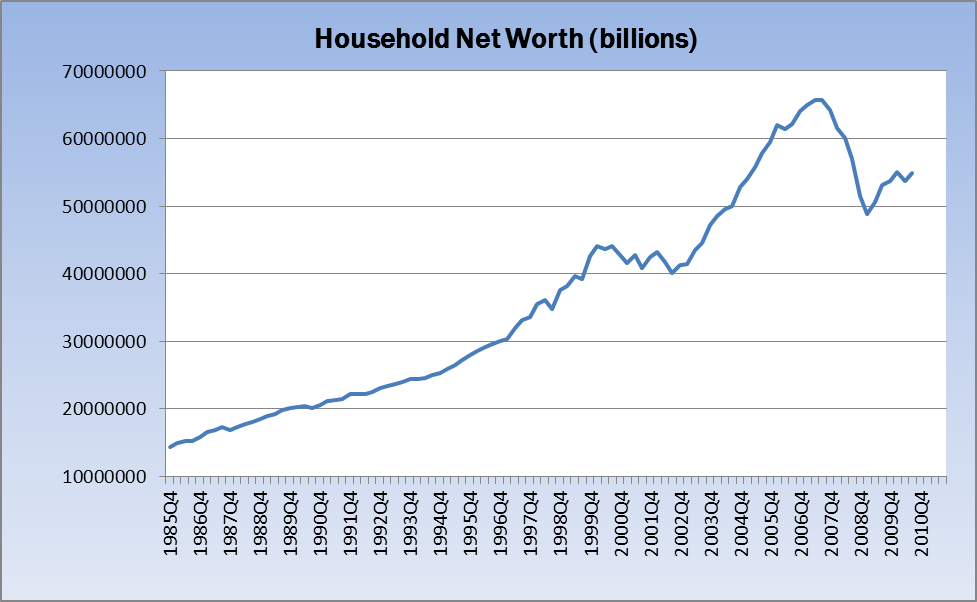
Household net worth rose to $54.9T, up $1.2T for the quarter but still down $10.8T from the $65.7T peak hit in the second quarter of 2007. Corporate Equities rose by over $900B, and Mutual Funds by almost $400B, while Real Estate declined by about $650B. All in, though, higher is better than lower (as always, click for larger charts):
>
>
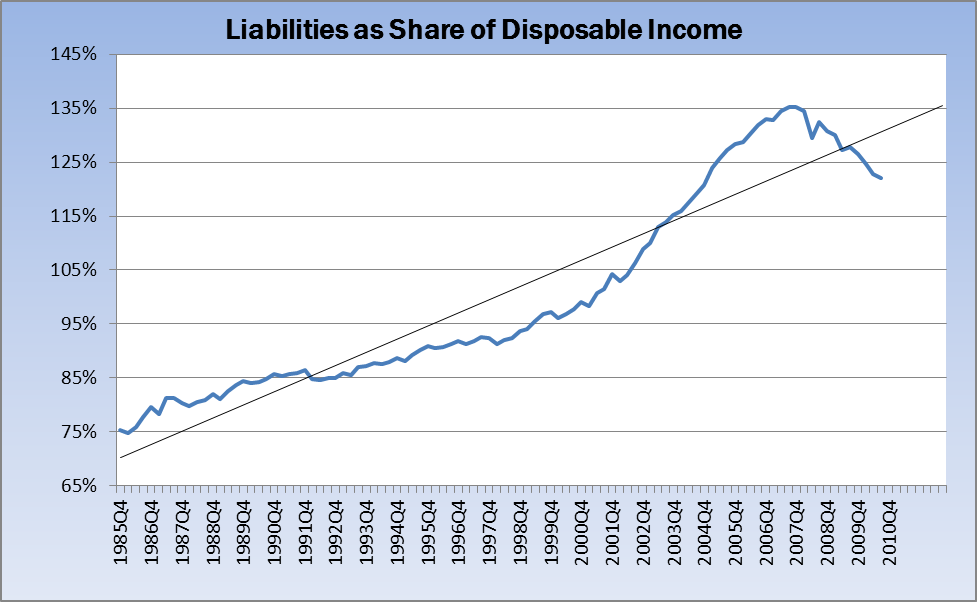
Liabilities as a share of disposable income continue to decline — now at 122%, down from 135%. I suspect this will remain below the trend line for quite some time, and it speaks to the ongoing deleveraging.
>
>
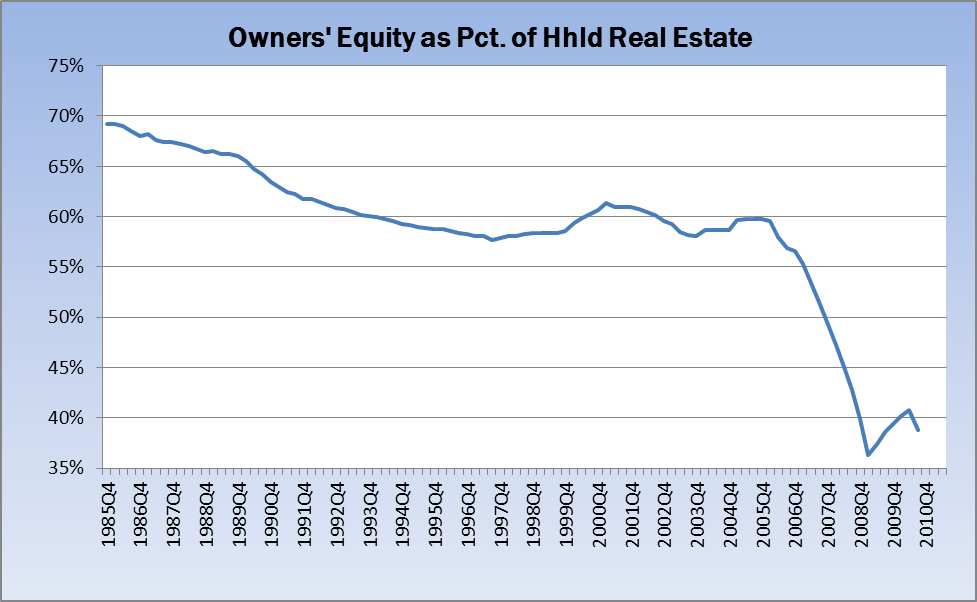
Owners’ equity as a percent of household real estate hooked down. It took decades (trust me on this one) for this metric to go from about 80% to around 60%, where it hovered for quite some time (1992 – 2005). All that changed in a few short, bubbly years, and we got down to what was hopefully a low at about 36%. As Josh Rosner so perfectly put it (in 2001 no less): A Home Without Equity is Just a Rental with Debt.
>
>
Last, but not least, a look at the changes over time in some — stress “some” — of the financial assets on the household balance sheet: Deposits (Line 9), Credit Market Instruments (Line 14), Corporate Equities (Line 24), and Mutual Funds (Line 25). I do not know the composition of the mutual funds (i.e. stocks, bonds, commodities, whatever). I called Helicpoter Ben’s office today but no one got back to me, so take that category with a grain of salt. This is essentially a time-series-view of the stocks/bonds/cash pie chart (with the unknown being the composition of the Mutual Funds category).
I’ll be crunching the numbers in this report a bit more, but don’t expect to find anything dramatic, as happened quarter after quarter during the recession. Will revisit this report when it next prints on March 10, 2011.


What's been said:
Discussions found on the web: