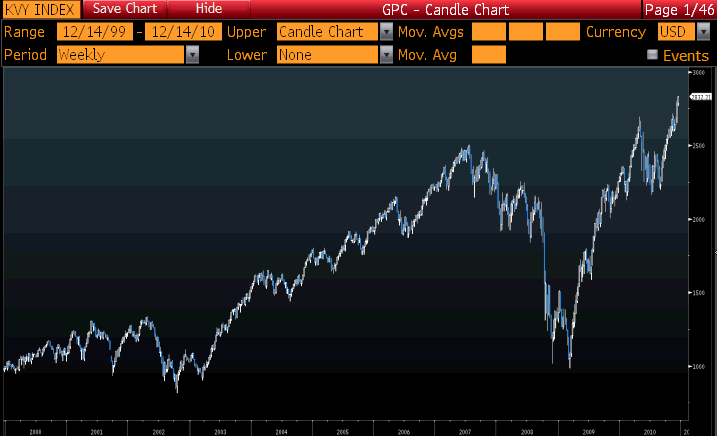
My pal David Rosenberg points out that the Value Line Arithmetic Composite Index is at an ALL TIME HIGH. (This is an equal weighted price index of the 1650 stocks surveyed by Value Line, averaged daily).
Dave writes: “The average stock, by the way, according to the Arithmetic Value line index, just hit a new all-time high. And not just a new high for the year, but a new high that breaks the old peak set in the fall of 2007.”
That statement is incorrect — No, the average stock is not at all time highs.
Dave errs in using the Value Line Arithmetic index — its 1650 stocks, disproportionately impacted by small, and microcap stocks. (Value Line Arithmetic membership list available from the Kansas City Board of Trade).
What this chart below reveals is that lots of smaller names have had great runs:
>
Value Line Arithmetic Index
>
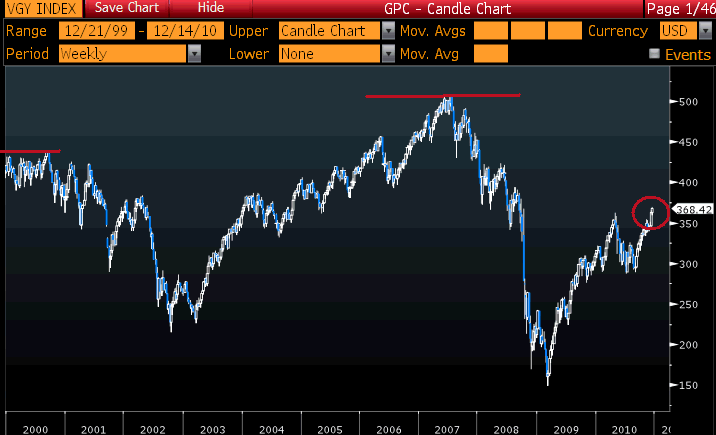
Meanwhile, the Value Line Geometric index — where tiny companies matter less and big companies matter more — tells a very different story. Not only is this index below the 2007 peak, its still below its 2000 highs!
>
Value Line Geometric Index
>
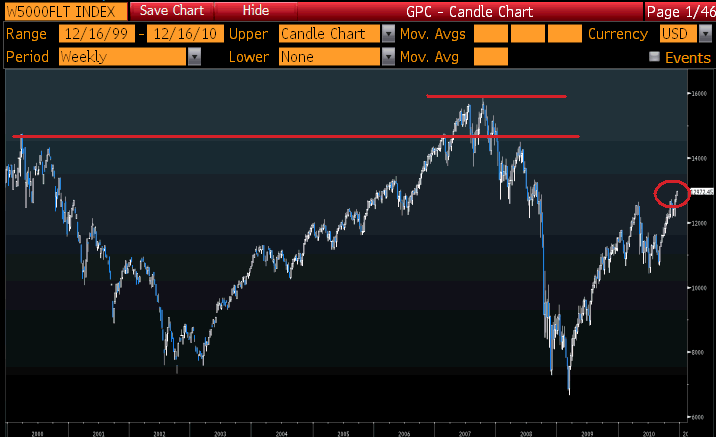
Last, let’s consider the full market –the Wilshire 5000, which is also market cap weighted. Same story here: Below both the 2007 and 2000 highs:
>


What's been said:
Discussions found on the web: