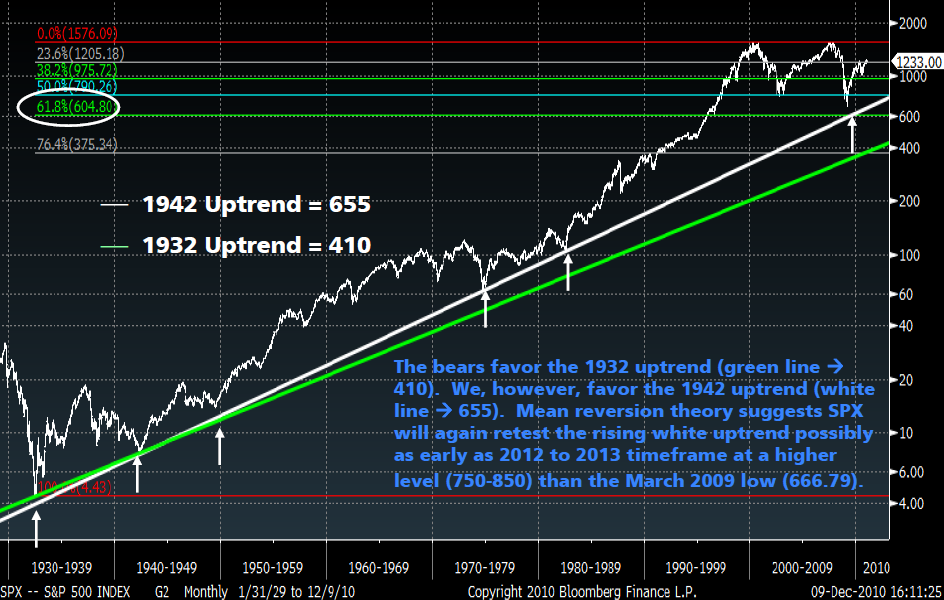
Yesterday’s long term chart from UBS’ Peter Lee started a conversation with a friend who is a (pure) technical trader about long term trend lines.
Some of the more bearish technical traders use a trend line that connects the 1929 low and the 1943 low — projected forward 60 years, it forecasts SPX 400.
That trend derived forecast has several problems: First, its so old, that small errors are greatly magnified. Like a satellite off by a few degree, by the time it reaches Pluto its nowhere near where its supposed to be. Same issue with projecting out decades. Also, the post-1929 lows might be considered aberrational.
Perhaps most importantly, trend lines are validated by the number of touches they make — the more the better — and so tagging not only 1942 (and near ’49), but ’73, ’82 and 2009 increases the validity of the trend line.
Funny thing is, I found a chart that does that — again, by UBS Peter Lee:
>
>
Source:
2011 Technical Market Outlook
Peter Lee – Chief Technical Strategist
Wealth Management Research
December 2010


What's been said:
Discussions found on the web: