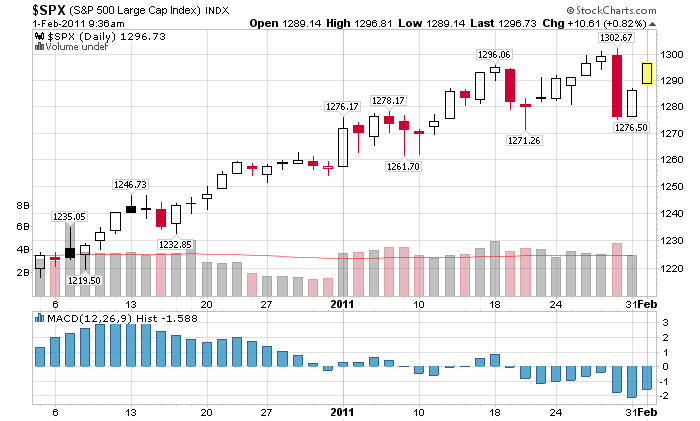
Yesterday, I reviewed the major indices, explaining why we are expecting a 5-8% correction at a minimum, and possibly an 8-12% whack over the next few months.
Whenever markets experience the intense selling of 90/90 days — those trading sessions when 90 percent of the volume is to the downside, and 9 out of 10 stocks close lower — it often marks a turning point in a bull run. The psychology is shifting, as institutions are changing postures from accumulation to distribution.
Of course, Mr. Market being devilishly sly, that cautious discussion was immediately met with futures screaming higher. But the bounce is not unexpected, and as we have seen in the past, strong downside flushes are often met with a short term pop.
Why? But Based on the work of Paul Desmond of Lowry’s (the oldest technical research firm in the US), we typically see a rally that lasts 2 – 7 days.
Think back to January 19th — a 90% downside day. As the chart below shows (first large red candle), that was followed by a short rally. And Friday’s 2% whoosh (second large red candle) is also likely to be followed by a short term pop.
There is one small twist worth reporting: Friday was not technically a 90/90 downside day. According to Lowry’s, down volume represented only 89.5% of total Up/Down Volume on the NYSE. And even more tantalizingly, the NASDAQ’s Points Lost was 89.9% of Points Gained, while Down Volume was 89.7% of Up/Down Volume. That is about as close as you can come to a 90/90 day. To quote Terry Knudsen, one of their technicians, “it is probably not going too far out on a limb to suggest another rebound rally lasting several sessions is possible following Friday’s sell-off.”
>
Previously:
Q&A: Paul Desmond of Lowry’s Reports (February 18th, 2006)
Part II — Q&A: Paul Desmond of Lowry’s Reports (February 19th, 2006)
>


What's been said:
Discussions found on the web: