With the recent passing of what would have been Ronald Reagan’s 100th birthday — and with President Obama having invoked his name — we have been treated to a steady stream of articles about our 40th president, most of them remembering him in the most glowing terms, particularly as it relates to his economic record. There’s this piece by Larry “King Dollar” Kudlow and this one by Arthur Laffer, among many others. But there are a few, like this one by Mike Kimel, author of the wonderful book Presimetrics (which I’ve temporarily put down to slog through the FCIC report) that, in my opinion, take a more objective view. In fact, it was Presimetrics that motivated me to take my own look at some data.
Reagan’s supporters have always glossed over the inconvenient truths about his economic record, as the aforementioned Mike Kimel points out:
By the time he left office, the national debt, which had been “approaching $1 trillion” had more than doubled to $2.7 trillion, and the stack of thousand-dollar bills that had been 67 miles high was now 193 miles high and rising fast. Interest payments on the debt—“over $90 billion” in 1981—were just shy of $200 billion in Reagan’s last year in office.
Using more relevant measures, real debt per capita (in 2008 dollars) grew from about $10,620 in 1980 to $19,860 in 1988, and from 32 percent of GDP to 51 percent of GDP over the same period. However you slice it, Reagan’s profligacy bore no resemblance to his promises.
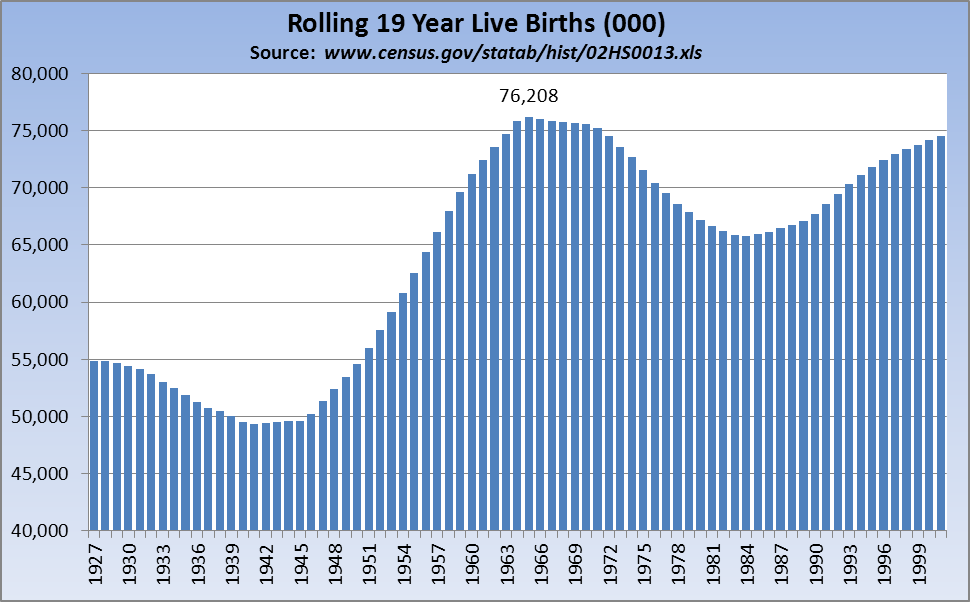
Purely as a matter of academic interest, I believe that among the tailwinds I believe Reagan had was the country’s demographics: The Baby Boom generation — some 76 million strong — was hitting its stride as Reagan took office, the oldest being about 35 when he took office, the youngest about 17. I’ve not seen any studies on how much of an economic impact this might have had, but I would speculate it was not negligible. Here is a chart showing just how big that pig in the python was in sheer numbers:
As noted, we’ll never really be able to quantify the influence of the Boomer cohort on the economics of the era, but common sense would tell us it provided some measure of benefit. If anyone’s aware of some peer-reviewed work out there on this subject, drop a link or reference in comments — I’m very interested. It’s interesting that the overwhelming body of work seems to be on the impact of an aging (retiring) Boomer population; precious little seems to have been done on how that cohort influenced our economy prior to their retirement years.
What I think might be instructive is an indexed look at Reagan and his successors (George H.W. Bush, Bill Clinton, George W. Bush, Barack Obama) in which I’ll level the playing field by rebasing many items to 100 at the beginning of each president’s term. (Plug for FRED — the ability to manipulate, transform, mix & match data (~25,000 data sets) with FRED is truly one of the wonders of the internet and by far one of its best uses. I cannot say enough about the work those folks do, and to their responsiveness when I have a question or encounter a glitch or problem.)
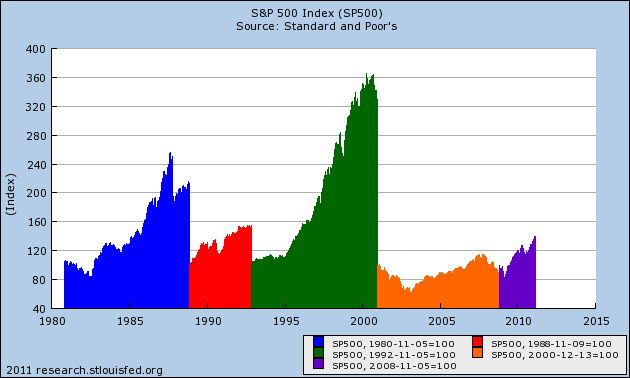
First up — since “Capital Markets” is one of TBP’s primary focuses — let’s take a look at the S&P500 by presidency. I’ve set the dates on this graph in each instance to just after election day, which is to say the day we knew who would be the CEO of U.S.A., Inc. In the case of the 2000 elections, I used December 13, 2000, the day after we knew the Supreme Court’s decision in Bush v. Gore.
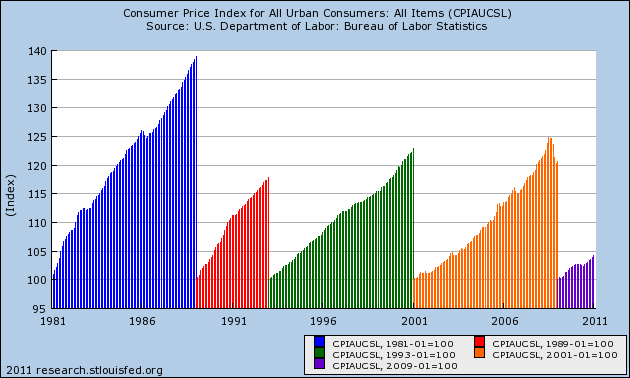
Since it goes without saying that inflation touches just about every aspect of our lives, a look at CPI over the past 30 years seems appropriate:
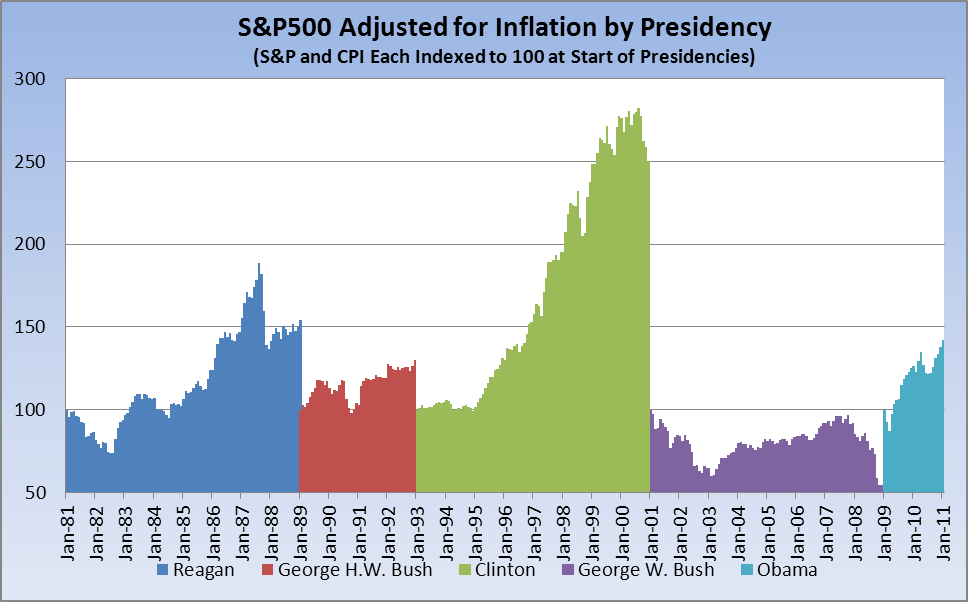
And, since we generally measure our returns (particularly in capital markets) on inflation-adjusted terms, I’ve indexed both the S&P500 and CPI to 100 at the start of each of the past five presidencies (essentially a combination of the two charts above):
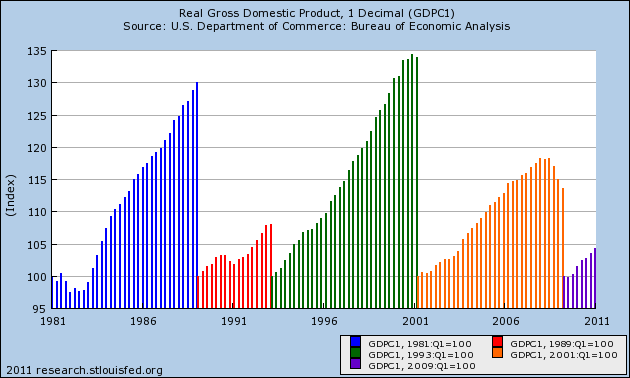
Of course no discussion of the economy is complete without a look at GDP, here’s how that shakes out over the past 30 years:
Within his first term, Reagan produced a deficit that was 6 percent of GDP. It was the highest the country had seen since the end of WW II. He got it down to 3.1 percent by his last year in office. (Note: There is no indexing in the chart below.)
Government spending. Huge issue right now, right? If nothing else, Reagan was certainly a small-government expense cutter. Or was he? Here’s a rebased chart of Federal Government Consumption Expenditures divided by GDP and indexed to 100 at the beginning of each president’s term.
Reagan’s expenditures as a percent of GDP were elevated for his entire presidency. George H.W. Bush managed to cut back somewhat, but it certainly is interesting to see who the real cost-cutter was.
Not only did Clinton cut the Federal Government’s Consumption Expenditures, he actually reduced the size of the Federal Government’s payroll:
(Note: This series is from BLS.gov; FRED does not capture it.)
(The decennial spikes are, obviously, related to the influx/outflow of census workers.)
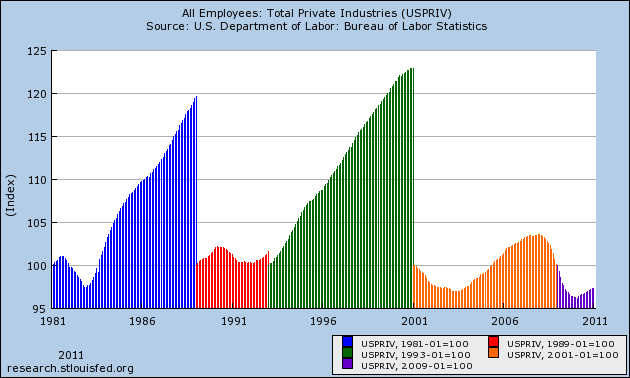
While Clinton cut the number of Federal employees, the economy surged in terms of private payrolls:
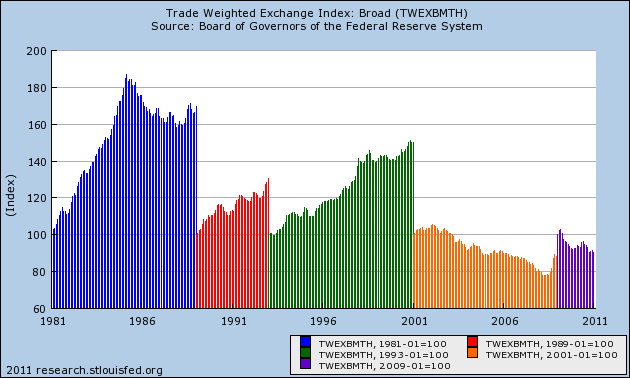
Reagan did preside over a period of significant dollar strength:
So, there’s a quick look at the past five presidencies in terms of Private Payrolls, Federal Jobs, the dollar, GDP, Government Expenditures, Inflation, Surplus/Deficit, the stock market, and an open question about how the Baby Boom generation may have figured into it all. Hope it’s been informative — I think it most definitely tells a story about economic stewardship.
When commenting, in addition to Barry’s standing caveat, please keep in mind these very sound pieces of advice and commentary from Mike Kimel’s Rules to Write By (one of which — #14 — addresses a gimmick that makes my blood boil):
14. No magic lags. Be consistent in your use of lags. If your analysis says that Reagan is responsible for growth during the Clinton administration, he better be responsible for growth during the Bush 1 administration too. And if Reagan is responsible for events that happened four to twelve years after he left office, explain why he isn’t responsible for events that happened 13 years after he left office. Also, explain why some predecessor of Reagan’s isn’t responsible for growth during Reagan’s administration.
19. Regardless of what you want to believe, real economic growth during the Reagan administration was slower than real growth during the FDR, JFK, LBJ and Clinton administrations. Two of these administrations raised marginal tax rates and one cut them. What these administrations had in common was a vision for expanding the role of government.




What's been said:
Discussions found on the web: