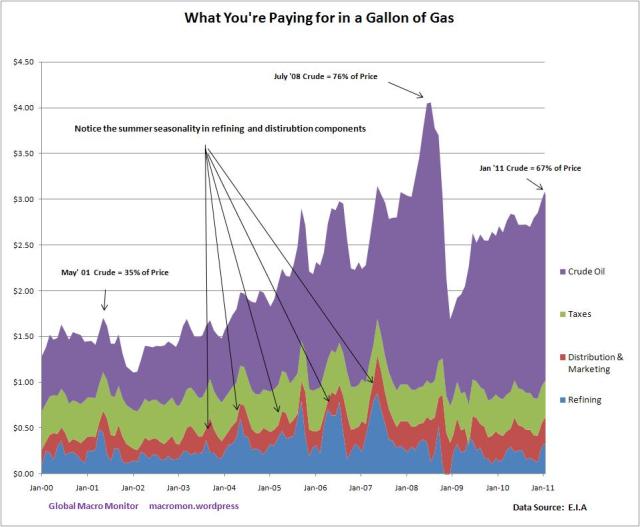
Traveling in California today we witnessed $4.00 gas and prompted us to think what makes up the price. We constructed the following chart from a U.S. Energy Information Agency (E.I.A.) time series.
Notice in May 2001 the crude component of a $1.71 gallon of gas was 35 percent of the price versus 76 percent during the Summer ’08 price spike. Also interesting is the 8 cent loss per gallon for refiners in November ’08 as they were caught holding expensive crude inventories as retail gasoline prices fell 60 percent from July to December.
What a potential toxic inflation brew: $4.00 gas price, zero percent interest rates, QE2, and an accelerating global economy. Bonds anyone? China better slow quickly.
The components for the gasoline are calculated in the following manner in cents per gallon:
Crude Oil – the monthly average of the composite refiner acquisition cost, which is the average price of crude oil purchased by refiners.
Refining Costs & Profits – the difference between the monthly average of the spot price of gasoline (used as a proxy for the value of gasoline as it exits the refinery) and the average price of crude oil purchased by refiners (the crude oil component).
Distribution & Marketing Costs & Profits – the difference between the average retail price of gasoline as computed from EIA’s weekly survey and the sum of the other 3 components.
Taxes – a monthly national average of federal and state taxes applied to gasoline.
(click here if chart is not observable)


What's been said:
Discussions found on the web: