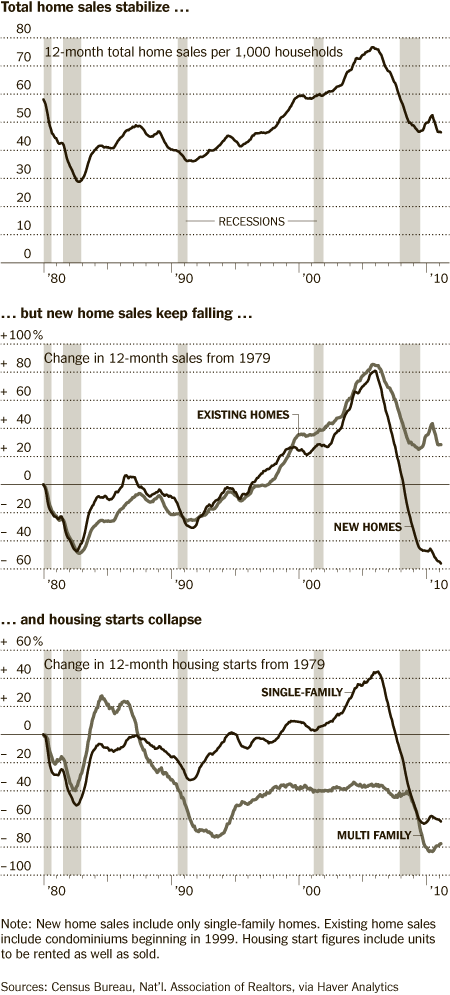
 Floyd Norris gives us the no nonsense take on Housing: Yes, Housing remains moribund; No, this is not getting better any time soon. The charts at right (click for larger version) should make that clear to anyone:
“As can be seen in the accompanying chart, during the 12 months through February, about 46 homes were sold for every 1,000 households in the country. At the peak of the housing boom, that figure rose above 75, but the current level is significantly higher than the lows reached during the recessions of the early 1980s and early 1990s.
The sales rate for existing homes — about 4.9 million over the last 12 months — is virtually the same as in mid-1999. Yet sales of newly built single-family homes have plunged to the lowest levels seen since the government began collecting statistics on such sales in 1963. The Census Bureau reported this week that only 17,000 new homes were sold in February, for an annual rate of 250,000 after taking seasonal factors into account. Both of those numbers are the lowest on record.”
Why? As low as rates are, they cannot make up for the lack of wage gains, the massive deleveraging, and the ongoing foreclosure activities.
>
Source:
A Housing Market Cycle Different From Others
FLOYD NORRIS
NYT, March 25, 2011
http://www.nytimes.com/2011/03/26/business/26charts.html


What's been said:
Discussions found on the web: