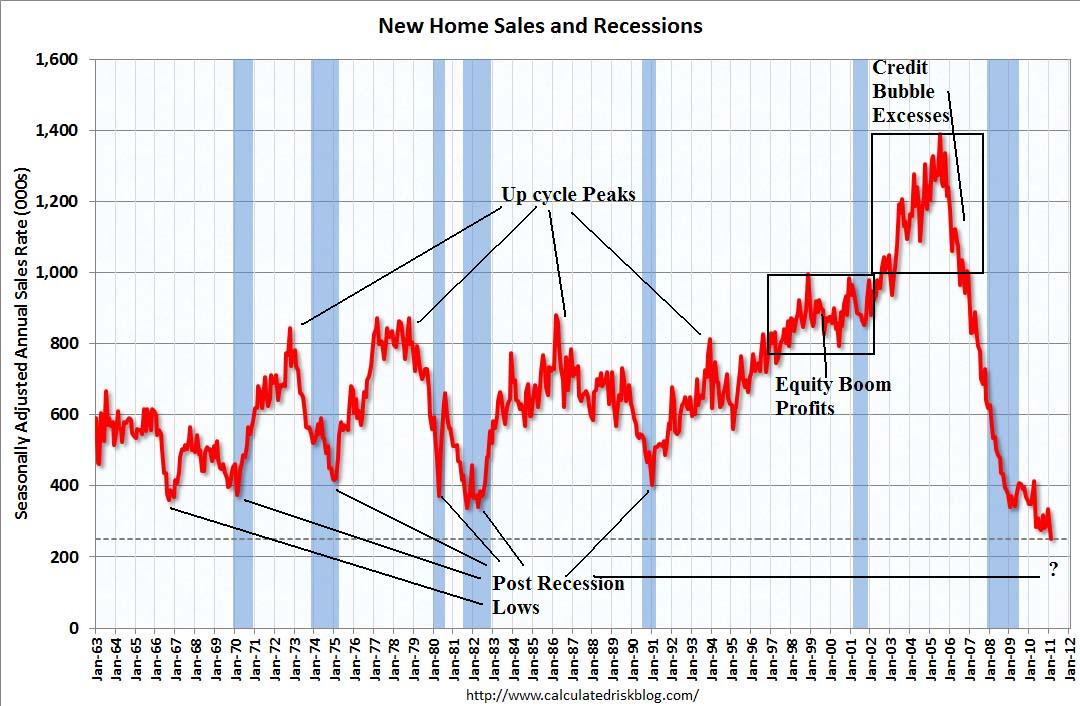
I want to direct your attention at two items related to New Home Sales: The chart below, and a post from 2005:
First, the post: New Home Sales Data: Don’t rely On It Either New Home Sales, which depend in large part on wself-reporting to Census from Home builders, are not especially reliable. There is a get to it next month quality that means any given month’s data can be wildly off. You are much better off taking a moving average of three months rather than relying on a single monthly data point.
Second, have a look at the trend of the New Home Sales chart: If you doubted my statement this morning that home prices remain overvalued, the chart makes that issue clear. Why buy a brand new home when 2 year old existing homes are selling for so much less?
Take a look at the historical peaks and valleys in the 1960s, 70s, and 80s. That changed in the 1990s — it broke out to a new level — a combination of population growth and a booming stock market led to some profit rotation from Equities into Real Estate.
The final phase was an entirely different order of magnitude . . .
>
The Residential Real Estate Ugliness in One Chart
click for larger ugliness

Original chart Calculated Risk; Annotations The Big Picture
>
Previously:
New Home Sales Data: Don’t rely On It Either (November 30th, 2005)
Should You Buy a Home? Looking (Again) at Housing (March 23, 2011)


What's been said:
Discussions found on the web: