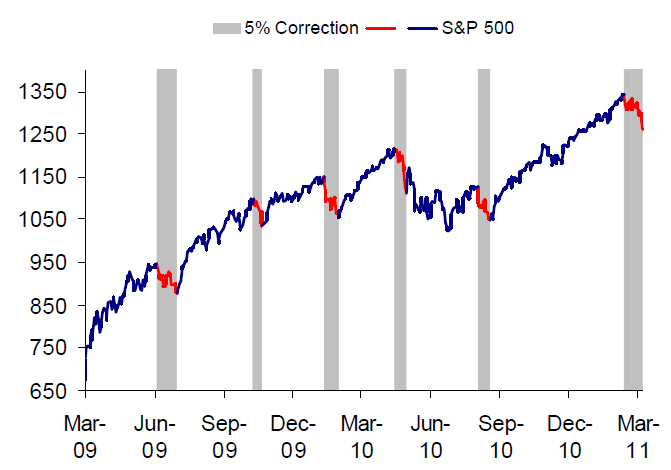
Interesting chart from Birinyi Associates:
>
S&P 500 5% Pullbacks (3/9/09 – 3/16/11)
>
They add:
“What is perhaps more encouraging is the fact that 5% declines do not usually result in a further 10% decline, and a bear market is even less likely. An initial 5% decline, such as the one beginning on 2/18/11, only results in a correction (10% decline) 33% of the time, and in only 11 of 106 instances has a 5% decline turned out to be a bull market top.”
In other words, in 10% of the times, a 5% correction marks a bull market top . . .


What's been said:
Discussions found on the web: