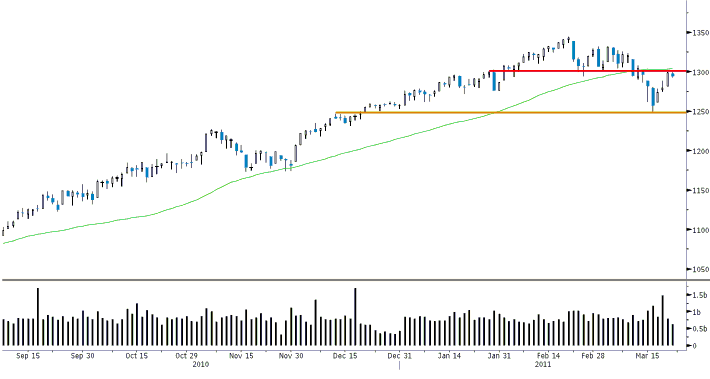
Kevin Lane of Fusion Analytics makes the observation: As seen in the chart above the S&P 500 stalled a bit yesterday near 1,300 (red line), which also coincides with its 50 day moving average (green line).
Support remains near 1,250 (orange line). For now we appear range bound after the recent crack and subsequent bounce. The one thing that impresses us is the markets ability to snap back considering the events thrown at it over the last several months such as the PIG(s) crisis and the earthquake in Japan. However the increasing volatility is not a positive as it suggest indecision.


What's been said:
Discussions found on the web: