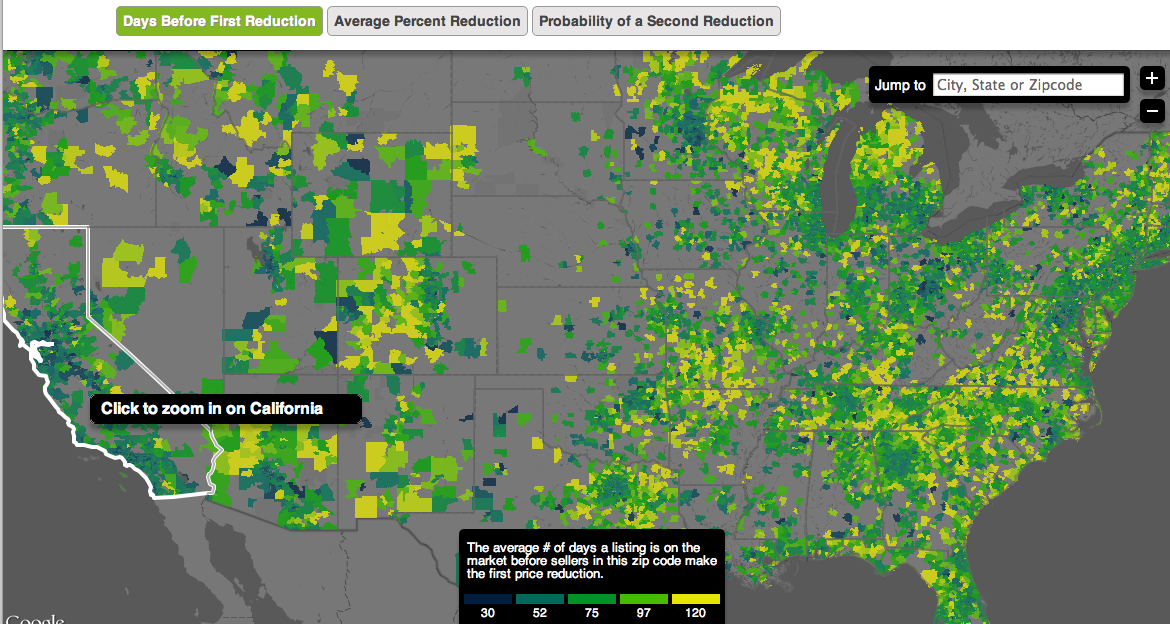
Trulia’s Home Offer Report is a a remarkable map — it shows the result of negotiation between homebuyers and sellers. The reveal shows how strong or weak the real-estate market is in every zip code of the country.
The three key metrics:
1) How long a house typically goes before the owner cuts the price;
2) The size of that price reduction;
3) The likelihood that there will be another reduction in price
Fascinating stuff that was not even possible just a few years ago:
>
click for larger interactive map

Hat tip Fast Code Design


What's been said:
Discussions found on the web: