Data addicts like me typically don’t care where our next fix comes from, as long as it’s credible. Most of the time I’m looking for correlations to jobs or incomes, in an effort to see where we might be headed or what we might reasonably do to improve the growth of either (or both). But sometimes the mind — and the mouse — wanders, and I find myself exploring new and different data sets with information completely unrelated to my usual areas of interest. And so it was recently.
Among the under-mined data repositories on the web is an off-shoot of the Council on State Governments, which maintains a very robust data set on various metrics for the individual states. The portal to the data I mined is here.
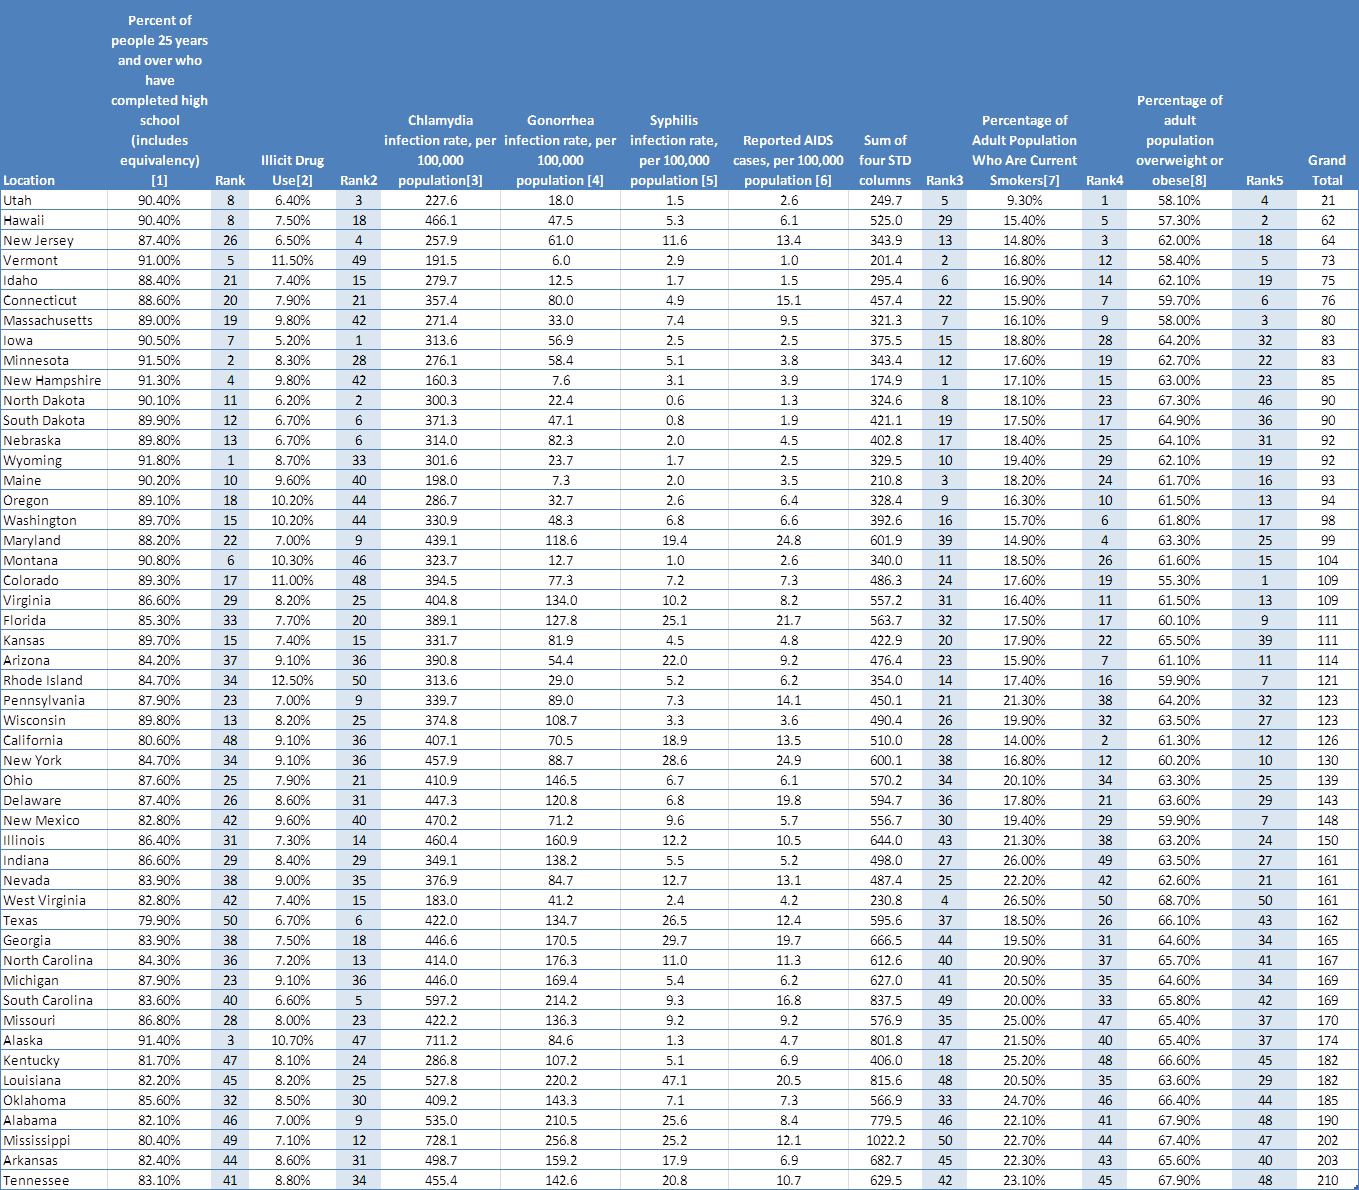
Using the data available at States Perform, I have created a table to rank the states by some less-desirable characteristics — five of them, to be exact:
- The percentage of people 25 years and under who have not completed high school
- Illicit drug use (ed note. – These figures seem awfully low to me)
- Rate, in the aggregate, of four STDs
- Percentage of Adult Population Who are Current Smokers
- Percentage of Adult Population Who are Overweight or Obese
As you can see, the “worst” state in any category gets a 50, the “best” gets a 1. As in golf, the lower the score, the better. A “perfect” score would be 5 (1 x 5 categories), a “perfectly hideous” score would be 250 (50 x 5 categories). And yes, a more rigorous analysis should probably assign some weightings (i.e. I would probably care less about the prospect of getting involved with a smoker than I would about contracting an STD), but this is light Sunday fare and not being submitted for peer review, so we’re going quick-and-dirty.
Draw your own inferences; single readers make your residency plans accordingly.>
Click for ginormous table
>
Sources (all via States Perform):
[1] U.S. Census Bureau, 2009 American Community Survey http://factfinder.census.gov/servlet/GRTSelectServlet?ds_name=ACS_2009_1YR_G00_&_lang=en
[2] SAMHSA, Office of Applied Studies, National Survey on Drug Use and Health http://oas.samhsa.gov/2k7State/AppB.htm Illicit drug use by those age 12+ in the past month. Illicit drugs include marijuana/hashish, cocaine (including crack), heroin, hallucinogens, inhalants, or prescription-type psychotherapeutics used nonmedically. Based on the results from the 2007 National Survey on Drug Use and Health.
[3] Centers for Disease Control and Prevention, Division of STD Prevention, Sexually Transmitted Disease Surveillance 2008: November 2009 http://www.cdc.gov/STD/stats08/surv2008-Complete.pdf
[4] Centers for Disease Control and Prevention, Division of STD Prevention, Sexually Transmitted Disease Surveillance 2008: November 2009 http://www.cdc.gov/STD/stats08/surv2008-Complete.pdf
[5] Centers for Disease Control and Prevention, Division of STD Prevention, Sexually Transmitted Disease Surveillance 2008: November 2009 http://www.cdc.gov/STD/stats08/surv2008-Complete.pdf
[6] Centers for Disease Control and Prevention, Divisions of HIV/AIDS Prevention, Reported AIDS cases and annual rates (per 100,000 population), by area of residence, 2006, 2007 and cumulative United States and dependent areas: 2009
[7] Centers for Disease Control and Prevention, National Center for Chronic Disease Prevention and Health Promotion, Behavioral Risk Factor Surveillance System, Tobacco Use 2008: 2009 http://apps.nccd.cdc.gov/brfss/list.asp?cat=TU&yr=2008&qkey=4396&state=All
[8] Centers for Disease Control and Prevention, National Center for Chronic Disease Prevention and Health Promotion, Behavioral Risk Factor Surveillance System, 2008 Overweight and Obesity (BMI): 2009 http://apps.nccd.cdc.gov/BRFSS/list.asp?cat=OB&yr=2008&qkey=4409&state=All
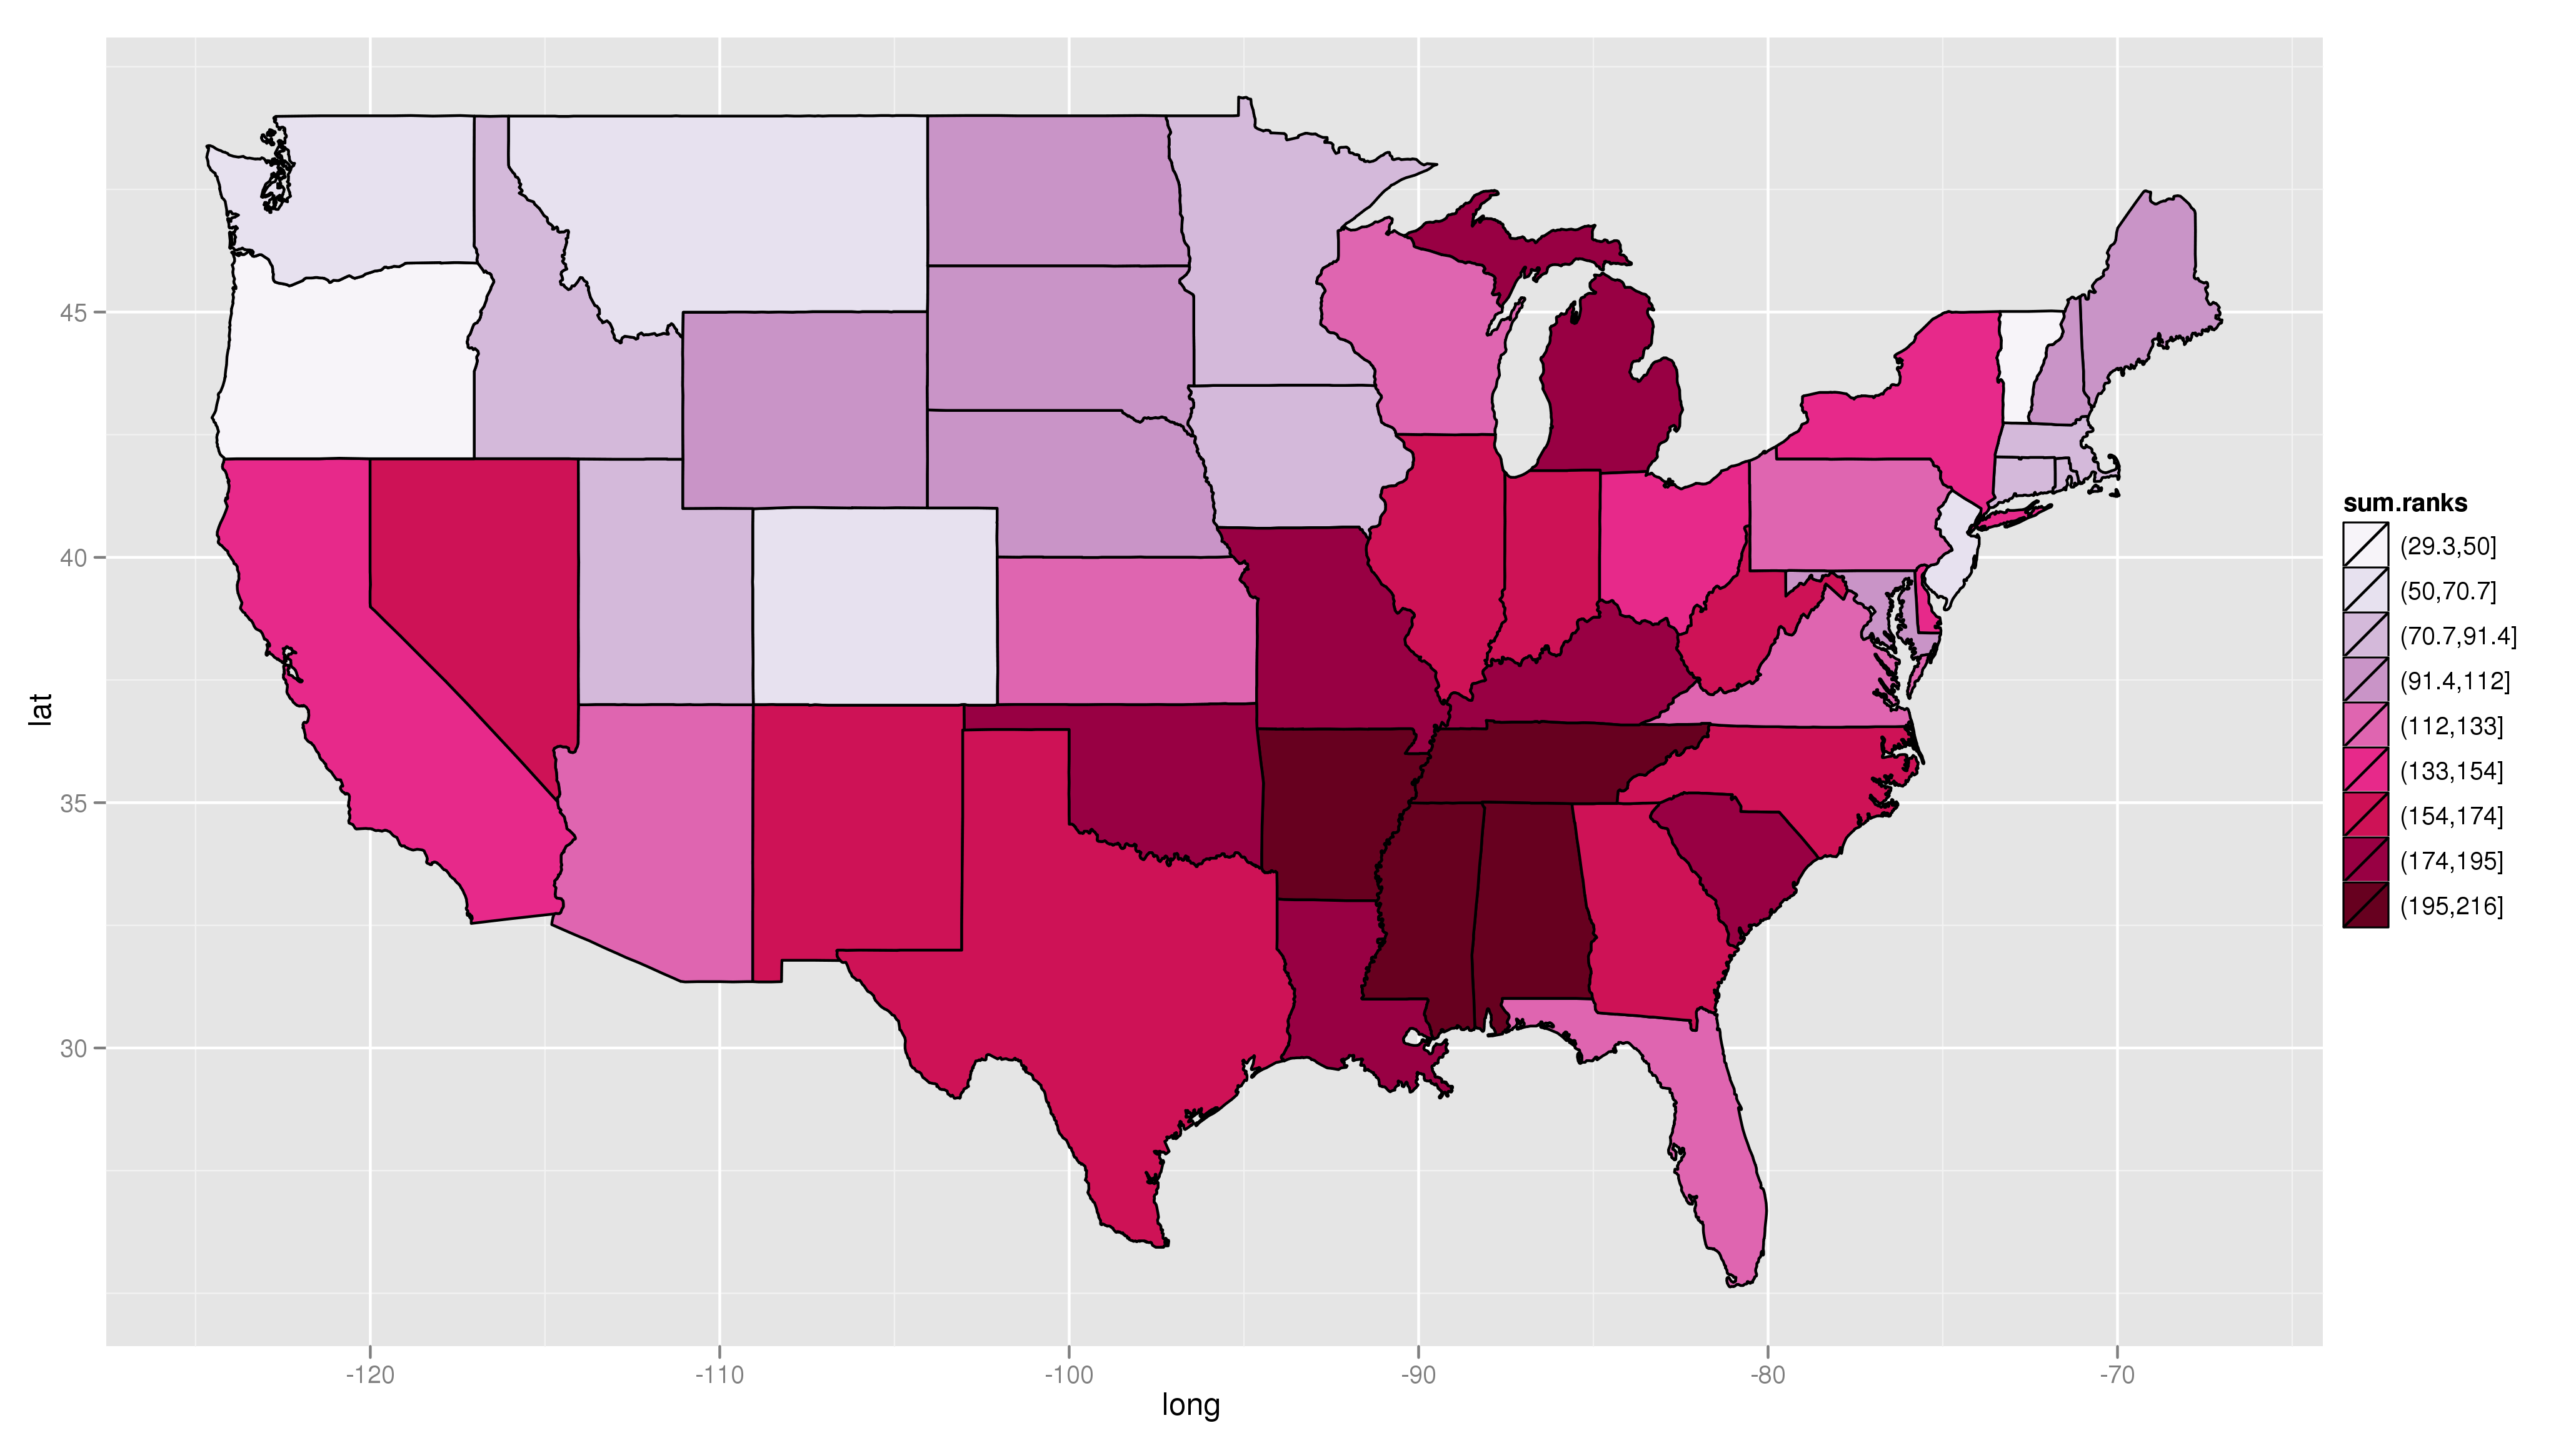
ADDING (May 3): Thanks to TBP reader Dr. Glenn Lawyer for composing the following heatmap. He notes very slight variances in ranking due to his use of R:
(Click through for ginormous)


What's been said:
Discussions found on the web: