Last week, we highlighted how earnings estimates were being gamed and have become more inaccurate in recent years.
If earnings estimates are no longer a good tool in predicting economic activity or market movements, can company guidance offer any insight?
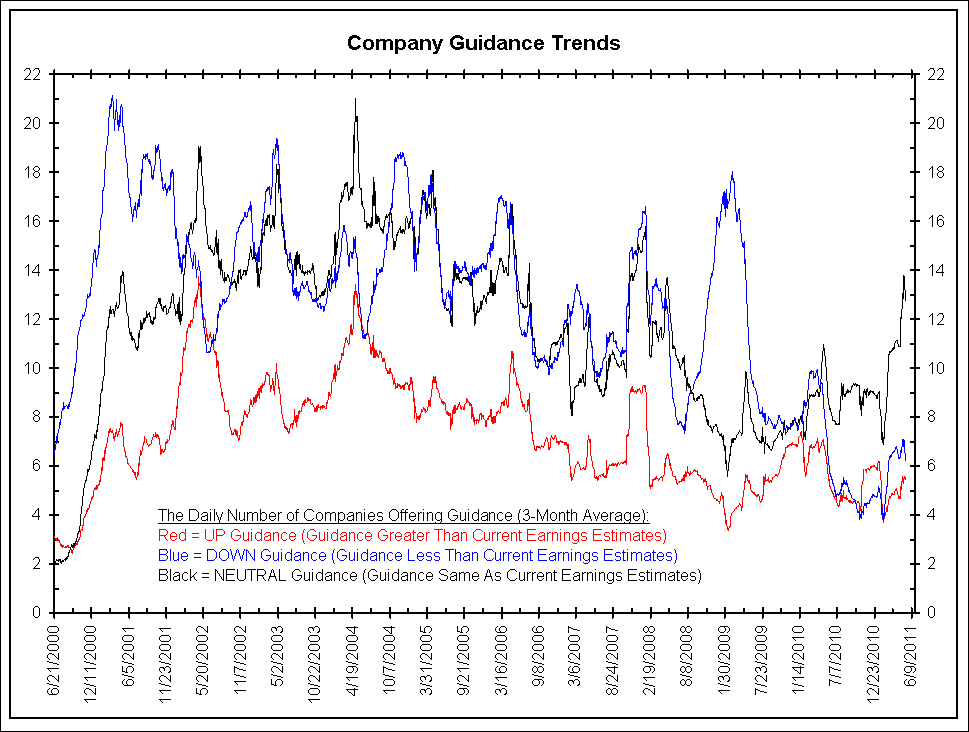
The chart below shows the daily number of companies offering positive guidance in red, negative guidance in blue, and neutral guidance in black. The sharp-eyed reader will note that positive guidance (red) is almost always below both negative guidance (blue) and neutral guidance (black). This means the majority of guidance is either neutral or down. Analysts are always too optimistic on future earnings, making it nearly impossible for a company to offer higher guidance than analysts’ estimates.
Company Guidance Trends
Click on chart for larger image
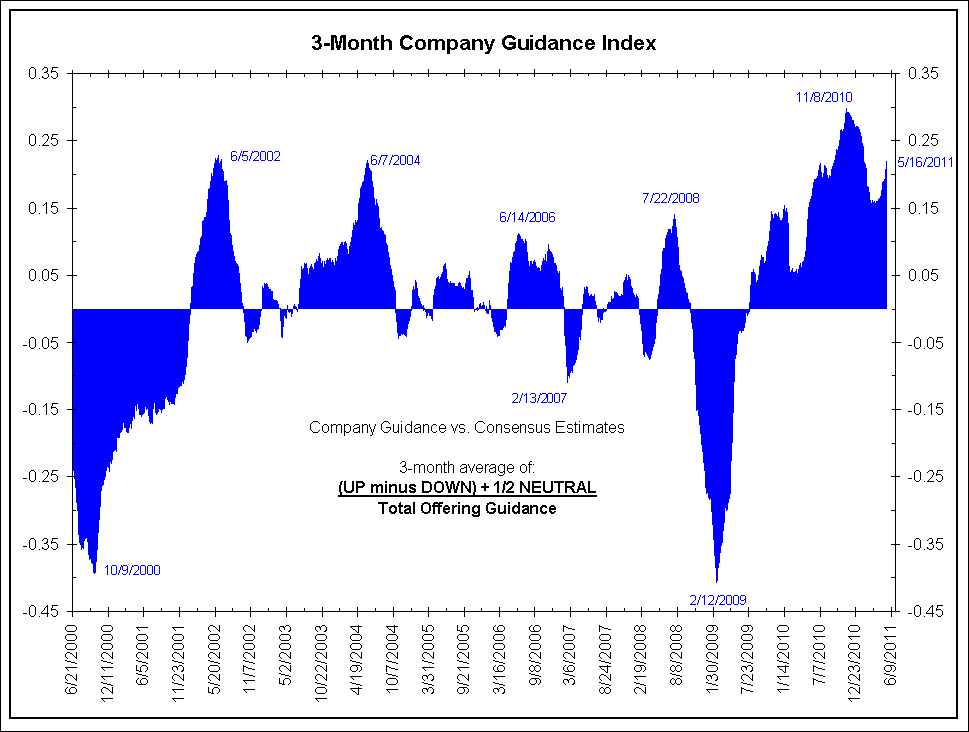
This index below plots the number of companies offering positive guidance minus those offering negative guidance plus 1/2 the number of companies offering neutral guidance divided by the total number of companies offering guidance. Neutral guidance gets a 1/2 weighting because affirming the consensus is not as important as offering guidance that differs from expectations (positive or negative).
A rising ratio means companies are offering relatively better guidance while a falling ratio means the opposite. By this measure guidance is more positive than usual.
3 Month Company Guidance Index
Click on chart for larger image
Does Guidance Lead The Economy?
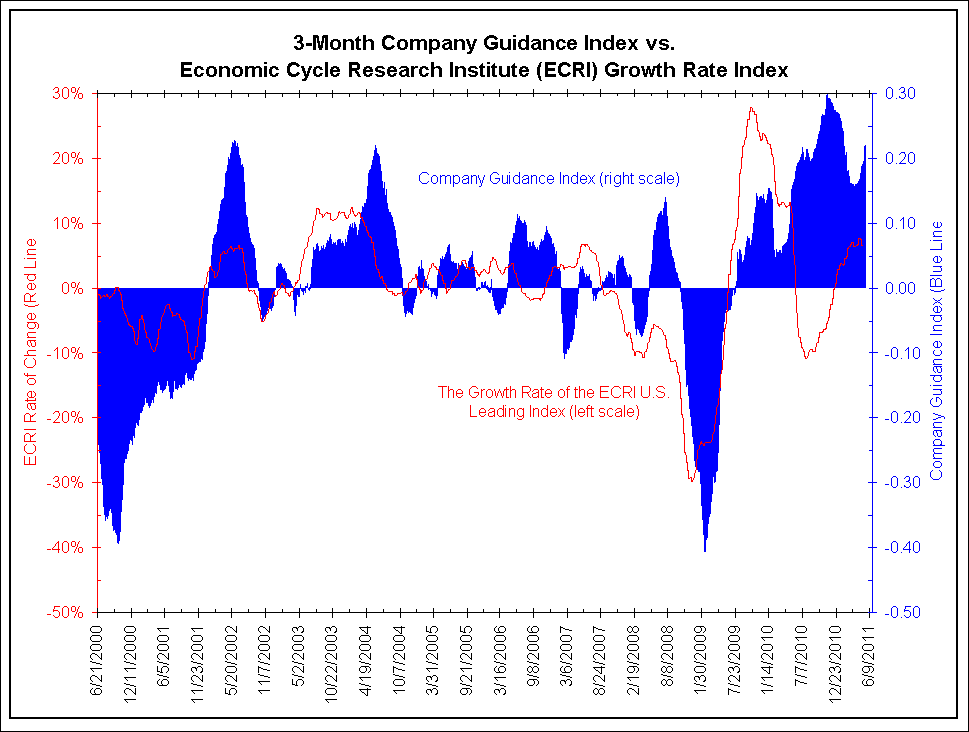
The next chart overlays the Company Guidance Index with the ECRI Growth Rate index. The ECRI is a weekly measure of seven economic releases that are supposed to lead the economy (detailed here).
Without running a statistical analysis, it is clear that the ECRI turns ahead of the Company Guidance Index. Currently the ECRI growth rate is heading down while the Company Guidance Index is heading higher. In the last year, any relationship between company guidance and the economy appears random. Divergences between these measures are often reconciled with the Company Guidance Index moving toward the ECRI and not the other way around. In other words, the ECRI leads the economy and the Company Guidance Index.
3 Months Company Guidance Index vs ECRI Growth Index
Click on chart for larger image
Does Guidance Lead The Stock Market?
If guidance is on the rise, should investors expect further gains in the stock market in the near future? In one word, no.
Let’s examine stock returns in the quarter immediately following previous peaks in the Company Guidance Index. The chart below plots the 3-month rate of change of the S&P 500 in red and the 3-month average of the Company Guidance Index in blue.
- The second-highest peak in the Company Guidance Index occurred on June 5, 2002. In the 3 months following that peak, the S&P 500 returned -14.44%.
- In the 3 months following the Company Guidance Index’ June 7, 2004 peak, the S&P 500 returned -0.89%.
- In the 3 months following the Company Guidance Index’ July 22, 2008 peak, the S&P 500 returned -28.70%.
This is not meant to imply that stocks fall soon after the Company Guidance Index peaks. However, the argument that rising guidance is positive for stocks is not supported by the data. A quick look at the chart shows a general lack of any relationship between these two measures. We are not surprised by this lack of correlation because many more things than company guidance (or forecasts) drive stock prices, especially in recent years.
3 Months Company Guidance Index vs S&P500 Rate of Change
Click on chart for larger image


What's been said:
Discussions found on the web: