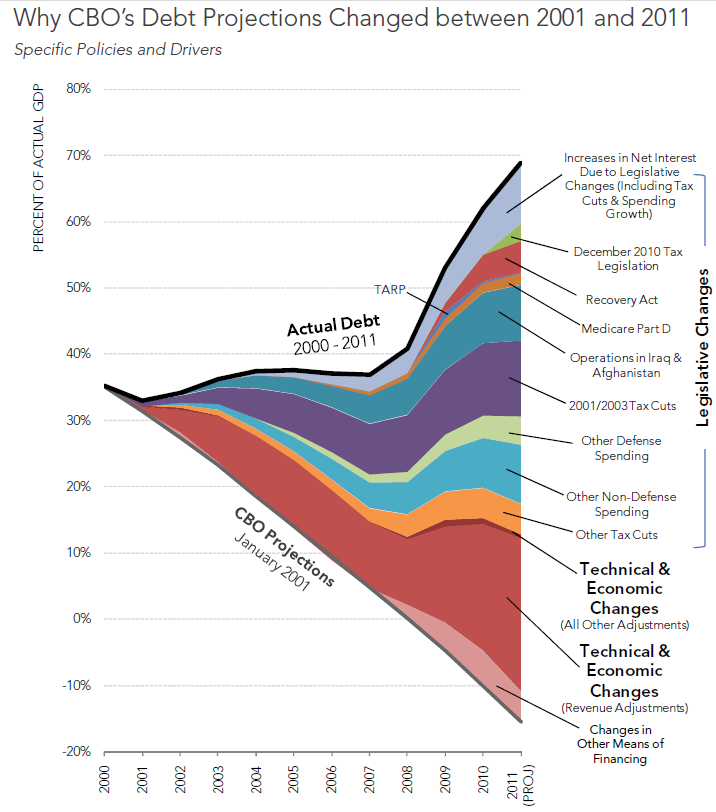
Excellent set of charts and analysis from the Pew Fiscal Analysis Initiative breaking down the sources of the deficit:
The U.S. will likely owe $10.4 trillion this year, its largest debt relative to the economy since 1950. However, the Congressional Budget Office (CBO) projected in 2001 that the federal government would erase its debt in 2006 and be $2.3 trillion in the black by 2011 – a $12.7 trillion difference from today’s reality.
This fact sheet highlights the extent to which major legislation enacted over the last decade and other factors have contributed to the Great Debt Shift – the difference between CBO’s 2001 projections and actual debt today.
Click for larger graphic
>
PDF here


What's been said:
Discussions found on the web: