History may not repeat, but it often rhymes.
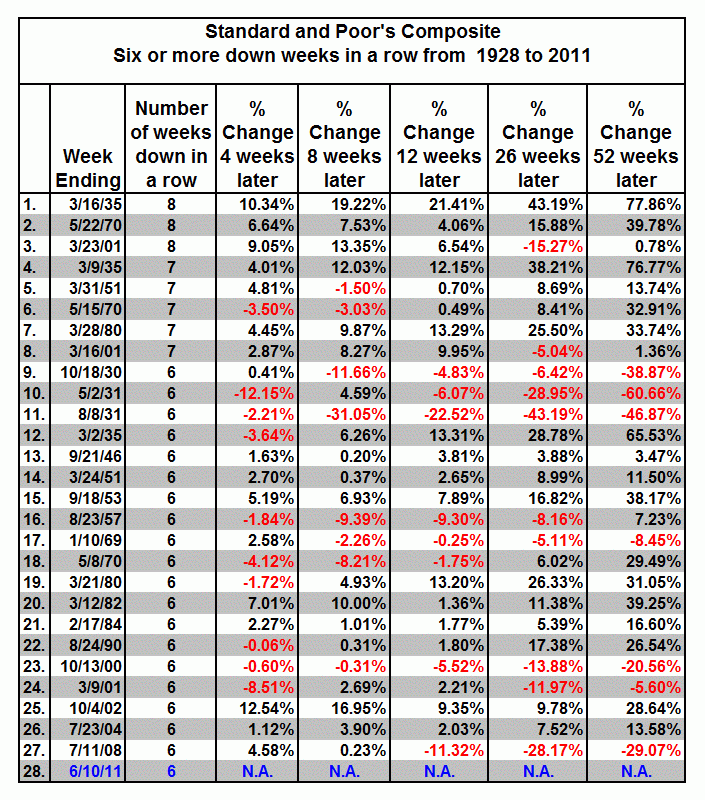
This table, assembled by Ron Griess of The Chart Store, shows what markets have done over the past century following any stretch of down 6 consecutive weeks.
The data reads both binary and inconclusive: If the markets are merely oversold, then you get a nice snapback, and one year later, the markets could have rallied anywhere from 1%-78%. But if the 6 weeks down is the start of a major correction or even market crash, one year later you could be down anywhere from 5% to 61%.
(I’d like to play with this data run a bit, and see what else I can conclude . . .)
>


What's been said:
Discussions found on the web: