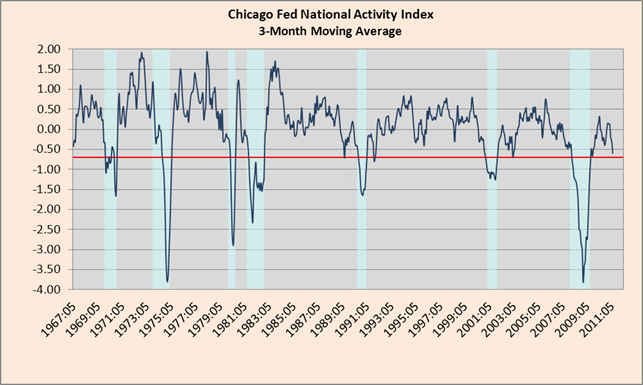
The Chicago Fed’s National Activity Index (CFNAI) printed this week. The CFNAI is among my favorite indicators that no one seems to follow (though it is covered monthly by Calculated Risk and usually David Rosenberg). It is an amalgam of 85 distinct economic indicators that gives a very accurate read on the economy. The folks in Chicago tell us to focus more on the three month moving average than the month-to-month number, and tell us further that, “When the CFNAI-MA3 value moves below –0.70 following a period of economic expansion, there is an increasing likelihood that a recession has begun.”
So, where are we as of this month’s print? Try -0.60, a mere 10 bps from what is likely recessionary terrain:
Source: Chicago Fed. Red line denotes likely recession threshhold.
I’ll outsource the commentary to Rosie (while noting for the record that I’d Tweeted about this in advance of his piece, lest I be accused of appropriating his work):
Note that the worst we got last summer was -0.28 so indeed, this is a different “soft patch” and perhaps a more pernicious one than we experienced in last year’s “head fake.” Also note that we hit -0.60 on the CFNAI index in January 2001 and March 2008, both times the major equity indices were off the highs but still close enough to be keeping the bull market psychology alive. Only in December 1991 and in April 2003 did we slip to -0.60 and actually not slip into contraction mode in the real economy; however, the former was still very close to the prior recession so it wasn’t even clear at that point that it was over; the latter was all about the Iraq war and proved temporary. It is debatable as to whether the similar move through -0.60 in July 1989 provided a false signal as it did lead the recession (again, a recession that nobody saw coming at the time) — at the very least it marked the nearing of the end for that long cycle of the 1980s and gave an early signal for investors to start trimming risk.
For the curious, next month’s print would have to be -1.09 to achieve a sum of -2.10 for three months (and hence a 3-mo ma of -0.70). While a drop from this month’s -0.46 to a -1.09 is rather large for this index, it is in the realm of historical experience. If I had to guess, I’d say we won’t hit the -0.70 three month moving average next month. But we are in dangerous territory to be sure.
Oh, and for the inflationistas in the audience, there’s this from the Chicago Fed:
When the CFNAI-MA3 value moves above +0.70 more than two years into an economic expansion, there is an increasing likelihood that a period of sustained increasing inflation has begun.
Translation: Don’t hold your breath.
Stay tuned.


What's been said:
Discussions found on the web: